The graph below shows cumulative proportions plotted against numbers of employees working in mid-sized retail establishments. 0.8+ 0.6+ 0.4 + 0.2 + 0.0 10 20 30 40 50 60 Number of employees 70 80 What is the approximate interquartile range? 68 O 35 O 57 O 75 O 18 Cumulative proportion
The graph below shows cumulative proportions plotted against numbers of employees working in mid-sized retail establishments. 0.8+ 0.6+ 0.4 + 0.2 + 0.0 10 20 30 40 50 60 Number of employees 70 80 What is the approximate interquartile range? 68 O 35 O 57 O 75 O 18 Cumulative proportion

Algebra: Structure And Method, Book 1
(REV)00th Edition
ISBN:9780395977224
Author:Richard G. Brown, Mary P. Dolciani, Robert H. Sorgenfrey, William L. Cole
Publisher:Richard G. Brown, Mary P. Dolciani, Robert H. Sorgenfrey, William L. Cole
Chapter7: Applying Fractions
Section7.2: Proportions
Problem 47WE

Related questions
Question
21
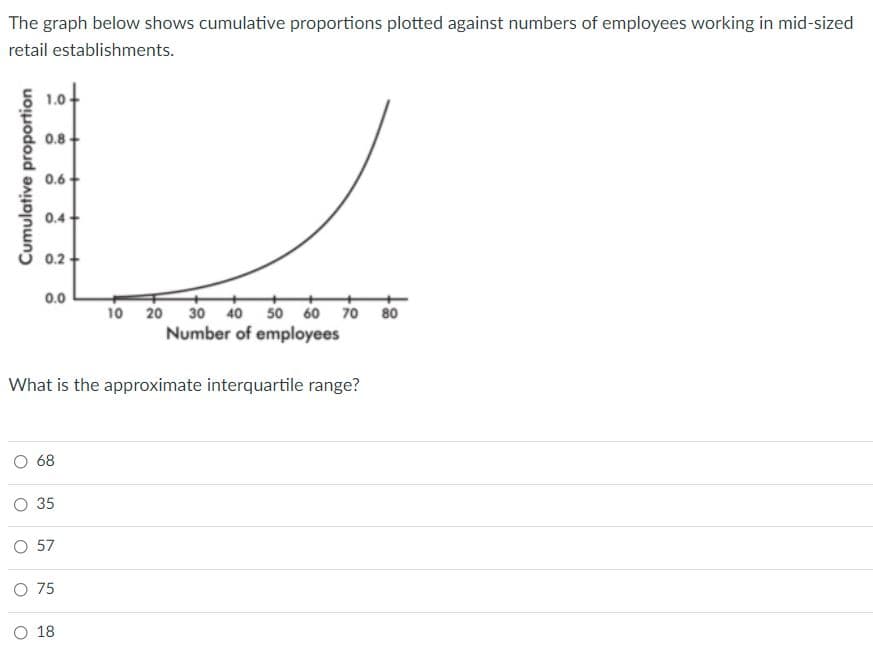
Transcribed Image Text:The graph below shows cumulative proportions plotted against numbers of employees working in mid-sized
retail establishments.
1.04
0.8
0.6+
0.4 +
0.2 +
0.0
10 20 30 40 50 60 70 80
Number of employees
What is the approximate interquartile range?
68
O 35
O 57
O 75
О 18
Cumulative proportion
Expert Solution
This question has been solved!
Explore an expertly crafted, step-by-step solution for a thorough understanding of key concepts.

This is a popular solution!

Trending now
This is a popular solution!

Step by step
Solved in 2 steps with 2 images

Recommended textbooks for you
Algebra: Structure And Method, Book 1
Algebra
ISBN:
9780395977224
Author:
Richard G. Brown, Mary P. Dolciani, Robert H. Sorgenfrey, William L. Cole
Publisher:
McDougal Littell

Glencoe Algebra 1, Student Edition, 9780079039897…
Algebra
ISBN:
9780079039897
Author:
Carter
Publisher:
McGraw Hill
Algebra: Structure And Method, Book 1
Algebra
ISBN:
9780395977224
Author:
Richard G. Brown, Mary P. Dolciani, Robert H. Sorgenfrey, William L. Cole
Publisher:
McDougal Littell
Glencoe Algebra 1, Student Edition, 9780079039897…
Algebra
ISBN:
9780079039897
Author:
Carter
Publisher:
McGraw Hill