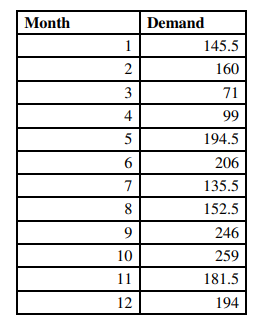
Data collected on the monthly demand for a certain product in thousands of dollars are shown in the following table. (see picture) a) Using a weighted moving average with three periods, determine the demand for period 13. Use 3, 2, and 1 for the weights of the most recent, second most recent, and third most recent periods, respectively. b) Find the MAD, MSE and MAPE.
Data collected on the monthly demand for a certain product in thousands of dollars are shown in the following table. (see picture) a) Using a weighted moving average with three periods, determine the demand for period 13. Use 3, 2, and 1 for the weights of the most recent, second most recent, and third most recent periods, respectively. b) Find the MAD, MSE and MAPE.

Practical Management Science
6th Edition
ISBN:9781337406659
Author:WINSTON, Wayne L.
Publisher:WINSTON, Wayne L.
Chapter13: Regression And Forecasting Models
Section: Chapter Questions
Problem 31P

Related questions
Question
Data collected on the monthly demand for a certain product in thousands of dollars are shown in the following table. (see picture)
a) Using a weighted moving average with three periods, determine the demand for period 13. Use 3, 2, and 1 for the weights of the most recent, second most recent, and
third most recent periods, respectively.
b) Find the MAD, MSE and MAPE.
Transcribed Image Text:Month
Demand
1
145.5
2
160
3
71
4
99
5
194.5
6
206
7
135.5
8
152.5
9.
246
10
259
11
181.5
12
194
Expert Solution
This question has been solved!
Explore an expertly crafted, step-by-step solution for a thorough understanding of key concepts.

Step by step
Solved in 2 steps with 2 images

Recommended textbooks for you
Practical Management Science
Operations Management
ISBN:
9781337406659
Author:
WINSTON, Wayne L.
Publisher:
Cengage,
Practical Management Science
Operations Management
ISBN:
9781337406659
Author:
WINSTON, Wayne L.
Publisher:
Cengage,