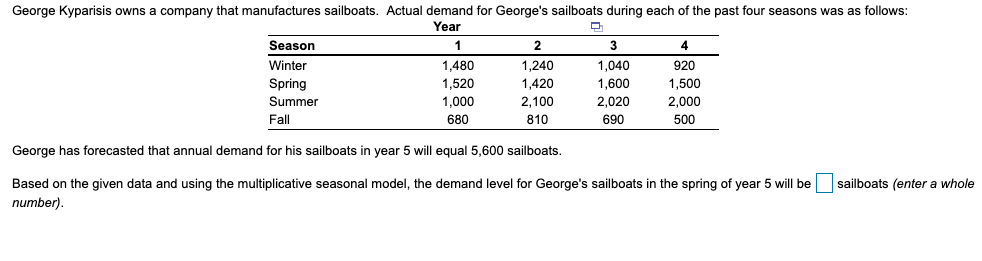
I using the multiplicative seasonal model, the demand level for George's sailboats in the spring of year 5 will be


Q: Given the following data, use exponential smoothing(a = 0.2) to develop a demand forecast. Assume…
A: Given data Exponential smoothing (a) or α= 0.2 Initial time period (F1) = 5 To develop the demand…
Q: The Saki motorcycle dealer in the Minneapolis–St. Paul area wants to make an accurate forecast of…
A: a) The Moving Average Forecast method uses the data from the past periods to forecast the value of…
Q: The options Outlook has for handling the seasonality of magazine are adding workers during the peak…
A: The problem statement right here is to make sure right making plans of manufacturing to meet…
Q: Case: Flamingo Educational Services Flamingo Educational Services, a company located in the…
A: We’ll answer the first question since the exact one wasn’t specified. Please submit a new question…
Q: Forecast February by: Arithmetic Average Weighted moving average, weights are 8 and 2. Which method…
A:
Q: Given the demand data, answer the following questions below. Year Sales 1 - 123 2 - 118 3 -…
A: A moving average is a method to obtain a complete analysis of the trends in a data kit; it is an…
Q: b. Discuss how forecasting accuracy relates to the practical application of aggregate planning.
A: Aggregate planning is the process that involves the development, analysis and other operational…
Q: The Bango Toy Company produces several types of toys to seasonal demand. The forecast for the next…
A: : Since we only answer up to 3 sub-parts, we’ll answer the first 3. Please resubmit the question and…
Q: In the past, Peter Kelle's tire dealership in Baton Rouge sold an average of 1,200 radials each…
A: Solution Season Year 1 Year 2 Average Fall 240 260 250 Winter 350 310…
Q: Forecast for period 24 using the following three methods: Exponential smoothing with alpha = 0.25;…
A: THE ANSWER IS AS BELOW:
Q: The average demand for January has been 80, and the average annual demandhas been 1800. Calculate…
A: Forecasting in operations management is a process by which predictions are made for the production.…
Q: ACTUAL DEMAND 2011 Spring 203 Summer 144
A: YEAR SEASONACTUAL DEMAND 2011 Spring 203 Summer 144 Fall 382 Winter 565…
Q: Flamingo Educational Services, a company located in the Tema metropolis, is a nationwide market…
A: Inventory management is keeping track of stock and monitoring it. It helps in minimizing the cost of…
Q: (i) MAD (ii) MAPD (iii) RSFE
A: AS PER THE GUIDELINES, WE ARE ONLY ALLOWED TO SOLVE FIRST THREE SUB-PARTS OF A QUESTION. SO, I AM…
Q: Using the actual demand shown in the table below, and a 3-month weighted moving average with weights…
A: Sl No. Months Demand 3-month Wt. Moving Average (weights: 0.1, 0.4, 0.5) 1 Nov 39 2 Dec 36…
Q: In the demand forecast, which of the following cannot be predicted? Select one: a. seasonal…
A: Demand forecasting is the process of predicting or estimating the future demand based on historical…
Q: Given the following history, use a three-quarter moving average to forecast the demandfor the third…
A: Given information:
Q: 45 & 46
A: Note: Answered the first question. Kindly post another question separatelyDetermine slope and…
Q: Over past 4 weeks, KAMM (Kuwait Arab Malls Monitor) reported a severe decline in French products…
A: Here, we could see that declination in the french products consumption, we would apply trend…
Q: Average demand for iPods in the Apple store in Rome, Italy, is800 units per month. The May monthly…
A: Given- Average demand = 800 units per month May monthly index = 1.25
Q: The following are historical demand data: ACTUAL YEAR SEASON DEILAND 204 2011 Spring Summer 150 Fall…
A: given,
Q: The following are historical demand data: ACTUAL DEMAND 205 YEAR SEASON 2 years ago Spring Summer…
A: Linear regression technique is employed when there is an observant down trend or uptrend in the data…
Q: a) The forecasted demand for the week of October 12 using a 3-week moving average = pints (round…
A: Forecasted demand is the future demand of customers predicted based on the previous data or demand.…
Q: Which among the following is the correct feature for staple merchandise categories?
A: Merchandise like men's crew socks, canned peas, college ruled loose-leaf paper, and 60-watt light…
Q: 1. Which of the following is indicative of the season of heaviest demand when seasonality is…
A: The seasonal index of 1.25 indicates the season of heaviest demand because this is 125% that shows…
Q: This historical demand for 4 periods demand is 70, 60, 80, and 90 respectively. What is the…
A: The two-period weighted moving average forecast for fifth period is in the next step
Q: Greenfield's Tannery supplies leather to the South Fork Boot Company on a monthly basis for…
A: From the given data: Here is the excel Formulation for Three month and Five month moving average
Q: In the past Peter Kelles tire dealership in Baton Rouge sold an average of 1,100 radial each year.…
A:
Q: The manager of the I-85 Carpet outlet needs to be able toforecast accurately the demand for Soft…
A: Forecasting is a tool which is based on past data and inputs and used in future trend projections.…
Q: Find the MAD and Tracking signal in below table. Do you think this forecast is acceptable? Why? How…
A: Given information- Period Actual demand Forecast 1 220 200 2 300 310 3 400 340 4 340 350…
Q: revenue forecast apply to sensitivity analysis
A: ‘Sensitivity Analysis’ is an instrument utilized in financial modelling to analyse how the various…
Q: In each of the following, name the term defined or answer the question. Answers are listed at the…
A: The term used to describe demand that is uncertain and needs to be forecast. Answer: Independent…
Q: Assume the weight is 0.6 for the most recent period; 0.2 for the second most recent; 0.1 for the…
A: YEAR PERIOD DEMAND FORECAST 2017 SEP 9400 OCT 10300 NOV 11200 DEC…
Q: Consider the following yearly demand values for a particular product. Year Demand 1 360 2 389 410 4…
A: The technical analysis methods used to smooth the data price by creating a regular updated average…
Q: A restaurant manager with analyzing records of the last 6 weeks summarizes the daily demand figures…
A: Forecasting can help in predicting the demand for the product in the future. There are various time…
Q: Tech company is medium-sized Consumer electronics retailer.The company reported $155,000,000 in…
A: The following information is given: Cost of goods sold= $110,050,000 Average inventory= $20,000,000…
Q: A restaurant manager with analyzing records of the last 6 weeks summarizes the daily demand figures…
A: Forecasting is critical for any business since it helps the organization to make informed business…
Q: Eastman Publishing Company is considering publishing an electronic textbook about spreadsheet…
A: Fixed cost F= $150,000 Variable cost c= $4 per book Selling price p= $43 per book Demand = 4000 - 6p…
Q: Matrix uses simple exponential smoothing with S.F = 0.6 to forecast demand. The forecast for the…
A: Below is the solution:-
Q: The operations manager has compiled data on demand for the two most popular books from order records…
A: Given data MONTH JHS Science SH Math 1 50 40 2 54 38 3 57 41 4 60 46 5 64 42…
Q: Find forecasting error from the following table by using Tracking Signal. Period Actual…
A: n = 6
Q: Calculate four periods moving average forecast from the following last six periods Period Demand 1…
A: Period Demand 1 38 2 40 3 42 4 40 5 44 6 38
Q: March demand was pridicted at 590 units of gear cycles of trevaa ltd. But the actual demand was 400…
A: Given: March demand forecasted (Ft-1) = 590 Units March actual demand (At-1) = 400 Units Alpha =…
Q: 2G MTN Zambia ll 78% 3:30 PM < OperationsManagement_HW1.. 4.12 Consider the following actual and…
A: Given Data, Day Actual demand Forecast Demand Monday 88 88 Tuesday 72 88…
Q: Given an actual demand this period of 143, a forecast value for this period of 119, and an alpha of…
A: Exponential smoothing is a period arrangement gauging strategy for univariate information that can…
Q: The following gives the number of pints of type Bblood used a t Woodlawn Hospital in the past 6…
A: The formulas to be used are as follows: 3-week moving average= sum of previous 3 week pints/number…
Q: Problem 3-28 (Algo) The following are historical demand data: АCTUAL DEMAND 206 YEAR SEASON Spring…
A: To anticipate demand on time series data, we'll use Excel software.First, we'll forecast using…
Q: Not all the items in your office supply store are evenly distributed as far as demand is concerned,…
A: Given- Week Demand Week 1 250 Week 2 350 Week 3 550 Week 4 650
Q: Specialty Toys, Inc., sells a variety of new and innovative children's toys. Management learned that…
A: : Since we only answer up to 3 sub-parts, we’ll answer the first 3. Please resubmit the question and…
Please answer the question listed below! Thanks!


Trending now
This is a popular solution!

Step by step
Solved in 4 steps

- The owner of a restaurant in Bloomington, Indiana, has recorded sales data for the past 19 years. He has also recorded data on potentially relevant variables. The data are listed in the file P13_17.xlsx. a. Estimate a simple regression equation involving annual sales (the dependent variable) and the size of the population residing within 10 miles of the restaurant (the explanatory variable). Interpret R-square for this regression. b. Add another explanatory variableannual advertising expendituresto the regression equation in part a. Estimate and interpret this expanded equation. How does the R-square value for this multiple regression equation compare to that of the simple regression equation estimated in part a? Explain any difference between the two R-square values. How can you use the adjusted R-squares for a comparison of the two equations? c. Add one more explanatory variable to the multiple regression equation estimated in part b. In particular, estimate and interpret the coefficients of a multiple regression equation that includes the previous years advertising expenditure. How does the inclusion of this third explanatory variable affect the R-square, compared to the corresponding values for the equation of part b? Explain any changes in this value. What does the adjusted R-square for the new equation tell you?The Baker Company wants to develop a budget to predict how overhead costs vary with activity levels. Management is trying to decide whether direct labor hours (DLH) or units produced is the better measure of activity for the firm. Monthly data for the preceding 24 months appear in the file P13_40.xlsx. Use regression analysis to determine which measure, DLH or Units (or both), should be used for the budget. How would the regression equation be used to obtain the budget for the firms overhead costs?The file P13_29.xlsx contains monthly time series data for total U.S. retail sales of building materials (which includes retail sales of building materials, hardware and garden supply stores, and mobile home dealers). a. Is seasonality present in these data? If so, characterize the seasonality pattern. b. Use Winters method to forecast this series with smoothing constants = = 0.1 and = 0.3. Does the forecast series seem to track the seasonal pattern well? What are your forecasts for the next 12 months?
- Suppose that a regional express delivery service company wants to estimate the cost of shipping a package (Y) as a function of cargo type, where cargo type includes the following possibilities: fragile, semifragile, and durable. Costs for 15 randomly chosen packages of approximately the same weight and same distance shipped, but of different cargo types, are provided in the file P13_16.xlsx. a. Estimate a regression equation using the given sample data, and interpret the estimated regression coefficients. b. According to the estimated regression equation, which cargo type is the most costly to ship? Which cargo type is the least costly to ship? c. How well does the estimated equation fit the given sample data? How might the fit be improved? d. Given the estimated regression equation, predict the cost of shipping a package with semifragile cargo.A small computer chip manufacturer wants to forecast monthly ozperating costs as a function of the number of units produced during a month. The company has collected the 16 months of data in the file P13_34.xlsx. a. Determine an equation that can be used to predict monthly production costs from units produced. Are there any outliers? b. How could the regression line obtained in part a be used to determine whether the company was efficient or inefficient during any particular month?The file P13_42.xlsx contains monthly data on consumer revolving credit (in millions of dollars) through credit unions. a. Use these data to forecast consumer revolving credit through credit unions for the next 12 months. Do it in two ways. First, fit an exponential trend to the series. Second, use Holts method with optimized smoothing constants. b. Which of these two methods appears to provide the best forecasts? Answer by comparing their MAPE values.
- The management of a technology company is trying to determine the variable that best explains the variation of employee salaries using a sample of 52 full-time employees; see the file P13_08.xlsx. Estimate simple linear regression equations to identify which of the following has the strongest linear relationship with annual salary: the employees gender, age, number of years of relevant work experience prior to employment at the company, number of years of employment at the company, or number of years of post secondary education. Provide support for your conclusion.The file P13_02.xlsx contains five years of monthly data on sales (number of units sold) for a particular company. The company suspects that except for random noise, its sales are growing by a constant percentage each month and will continue to do so for at least the near future. a. Explain briefly whether the plot of the series visually supports the companys suspicion. b. By what percentage are sales increasing each month? c. What is the MAPE for the forecast model in part b? In words, what does it measure? Considering its magnitude, does the model seem to be doing a good job? d. In words, how does the model make forecasts for future months? Specifically, given the forecast value for the last month in the data set, what simple arithmetic could you use to obtain forecasts for the next few months?The file P13_28.xlsx contains monthly retail sales of U.S. liquor stores. a. Is seasonality present in these data? If so, characterize the seasonality pattern. b. Use Winters method to forecast this series with smoothing constants = = 0.1 and = 0.3. Does the forecast series seem to track the seasonal pattern well? What are your forecasts for the next 12 months?
- The file P13_26.xlsx contains the monthly number of airline tickets sold by the CareFree Travel Agency. a. Create a time series chart of the data. Based on what you see, which of the exponential smoothing models do you think will provide the best forecasting model? Why? b. Use simple exponential smoothing to forecast these data, using a smoothing constant of 0.1. c. Repeat part b, but search for the smoothing constant that makes RMSE as small as possible. Does it make much of an improvement over the model in part b?Under what conditions might a firm use multiple forecasting methods?Stock market analysts are continually looking for reliable predictors of stock prices. Consider the problem of modeling the price per share of electric utility stocks (Y). Two variables thought to influence this stock price are return on average equity (X1) and annual dividend rate (X2). The stock price, returns on equity, and dividend rates on a randomly selected day for 16 electric utility stocks are provided in the file P13_15.xlsx. Estimate a multiple regression equation using the given data. Interpret each of the estimated regression coefficients. Also, interpret the standard error of estimate and the R-square value for these data.

