Data from a non-profit organization give the cause of spillage for 460 oil tanker accidents resulting in spills of more than 700 tons of oil from 1970–2010. The data are displayed in 2 accompanying charts. Complete parts a) and b) below. LOADING... Click the icon to view the bar chart of oil spillage causes. LOADING... Click the icon to view the pie chart of oil spillage causes. a) Write a brief report interpreting what the displays show. Choose the correct answer below. A. The charts show that grounding, fire and explosion are the most frequent causes of oil spills. Many also have unknown causes. B. The charts show that grounding and collision are the most frequent causes of oil spills. Very few have unknown causes. C. The charts show that hull failure, fire, and explosion are the most frequent causes of oil spills. Very few have unknown causes. D. The charts show that hull failure and collision are the most frequent causes of oil spills. Many also have unknown causes. b) Is a pie chart an appropriate display for these data? Why or why not? A. A pie chart does not seem appropriate for these data because the proportions shown by each slice of the pie add up to 100%, and each oil spill falls into only one category. B. A pie chart does not seem appropriate for these data because the proportions shown by each slice of the pie add up to 100%, and some oils spills fall into more than one category. C. A pie chart seems appropriate for these data because the proportions shown by each slice of the pie add up to 100%, and each oil spill falls into only one category. D. A pie chart seems appropriate for these data because the proportions shown by each slice of the pie add up to 100%, and some oils spills fall into more than one category.
Data from a non-profit organization give the cause of spillage for 460 oil tanker accidents resulting in spills of more than 700 tons of oil from 1970–2010. The data are displayed in 2 accompanying charts. Complete parts a) and b) below. LOADING... Click the icon to view the bar chart of oil spillage causes. LOADING... Click the icon to view the pie chart of oil spillage causes. a) Write a brief report interpreting what the displays show. Choose the correct answer below. A. The charts show that grounding, fire and explosion are the most frequent causes of oil spills. Many also have unknown causes. B. The charts show that grounding and collision are the most frequent causes of oil spills. Very few have unknown causes. C. The charts show that hull failure, fire, and explosion are the most frequent causes of oil spills. Very few have unknown causes. D. The charts show that hull failure and collision are the most frequent causes of oil spills. Many also have unknown causes. b) Is a pie chart an appropriate display for these data? Why or why not? A. A pie chart does not seem appropriate for these data because the proportions shown by each slice of the pie add up to 100%, and each oil spill falls into only one category. B. A pie chart does not seem appropriate for these data because the proportions shown by each slice of the pie add up to 100%, and some oils spills fall into more than one category. C. A pie chart seems appropriate for these data because the proportions shown by each slice of the pie add up to 100%, and each oil spill falls into only one category. D. A pie chart seems appropriate for these data because the proportions shown by each slice of the pie add up to 100%, and some oils spills fall into more than one category.

MATLAB: An Introduction with Applications
6th Edition
ISBN:9781119256830
Author:Amos Gilat
Publisher:Amos Gilat
Chapter1: Starting With Matlab
Section: Chapter Questions
Problem 1P

Related questions

Question
Data from a non-profit organization give the cause of spillage for 460 oil tanker accidents resulting in spills of more than 700 tons of oil from
1970–2010.
The data are displayed in 2 accompanying charts. Complete parts a) and b) below.LOADING...
LOADING...
a) Write a brief report interpreting what the displays show. Choose the correct answer below.
The charts show that grounding, fire and explosion are the most frequent causes of oil spills. Many also have unknown causes.
The charts show that grounding and collision are the most frequent causes of oil spills. Very few have unknown causes.
The charts show that hull failure, fire, and explosion are the most frequent causes of oil spills. Very few have unknown causes.
The charts show that hull failure and collision are the most frequent causes of oil spills. Many also have unknown causes.
b) Is a pie chart an appropriate display for these data? Why or why not?
A pie chart does not seem appropriate for these data because the proportions shown by each slice of the pie add up to 100%, and each oil spill falls into only one category.
A pie chart does not seem appropriate for these data because the proportions shown by each slice of the pie add up to 100%, and some oils spills fall into more than one category.
A pie chart seems appropriate for these data because the proportions shown by each slice of the pie add up to 100%, and each oil spill falls into only one category.
A pie chart seems appropriate for these data because the proportions shown by each slice of the pie add up to 100%, and some oils spills fall into more than one category.
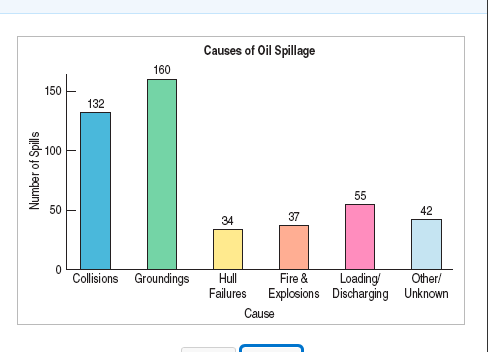
Transcribed Image Text:Causes of Oil Spillage
160
150
132
100
55
50
42
34
37
Collisions Groundings
Hull
Failures
Loading
Explosions Discharging Unknown
Fire &
Other/
Cause
Number of Spills
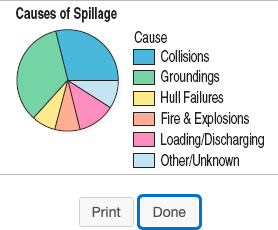
Transcribed Image Text:Causes of Spillage
Cause
Collisions
Groundings
Hull Failures
Fire & Explosions
Loading/Discharging
Other/Unknown
Print
Done
Expert Solution
This question has been solved!
Explore an expertly crafted, step-by-step solution for a thorough understanding of key concepts.

This is a popular solution!

Trending now
This is a popular solution!

Step by step
Solved in 3 steps

Knowledge Booster


Learn more about
Need a deep-dive on the concept behind this application? Look no further. Learn more about this topic, statistics and related others by exploring similar questions and additional content below.Recommended textbooks for you
MATLAB: An Introduction with Applications
Statistics
ISBN:
9781119256830
Author:
Amos Gilat
Publisher:
John Wiley & Sons Inc

Probability and Statistics for Engineering and th…
Statistics
ISBN:
9781305251809
Author:
Jay L. Devore
Publisher:
Cengage Learning

Statistics for The Behavioral Sciences (MindTap C…
Statistics
ISBN:
9781305504912
Author:
Frederick J Gravetter, Larry B. Wallnau
Publisher:
Cengage Learning
MATLAB: An Introduction with Applications
Statistics
ISBN:
9781119256830
Author:
Amos Gilat
Publisher:
John Wiley & Sons Inc
Probability and Statistics for Engineering and th…
Statistics
ISBN:
9781305251809
Author:
Jay L. Devore
Publisher:
Cengage Learning
Statistics for The Behavioral Sciences (MindTap C…
Statistics
ISBN:
9781305504912
Author:
Frederick J Gravetter, Larry B. Wallnau
Publisher:
Cengage Learning

Elementary Statistics: Picturing the World (7th E…
Statistics
ISBN:
9780134683416
Author:
Ron Larson, Betsy Farber
Publisher:
PEARSON

The Basic Practice of Statistics
Statistics
ISBN:
9781319042578
Author:
David S. Moore, William I. Notz, Michael A. Fligner
Publisher:
W. H. Freeman

Introduction to the Practice of Statistics
Statistics
ISBN:
9781319013387
Author:
David S. Moore, George P. McCabe, Bruce A. Craig
Publisher:
W. H. Freeman