Data from the financial statements of Albi Foods and Unimart, Inc., two national grocery chains are presented below: Albi Foods Unimart, Inc. Total liabilities, 2021 $43,610 $23,817 Total liabilities, 2020 48,239 21,935 Total assets, 2021 64,743 29,652 Total assets, 2020 67,582 32,589 Revenue, 2021 200,693 81,494 Net income, 2021 ... 2,312 1,062 To the nearest hundredth, what is the 2021 debt-to-equity ratio for Albi Foods?
Data from the financial statements of Albi Foods and Unimart, Inc., two national grocery chains are presented below: Albi Foods Unimart, Inc. Total liabilities, 2021 $43,610 $23,817 Total liabilities, 2020 48,239 21,935 Total assets, 2021 64,743 29,652 Total assets, 2020 67,582 32,589 Revenue, 2021 200,693 81,494 Net income, 2021 ... 2,312 1,062 To the nearest hundredth, what is the 2021 debt-to-equity ratio for Albi Foods?

Chapter1: Financial Statements And Business Decisions
Section: Chapter Questions
Problem 1Q

Related questions
Question
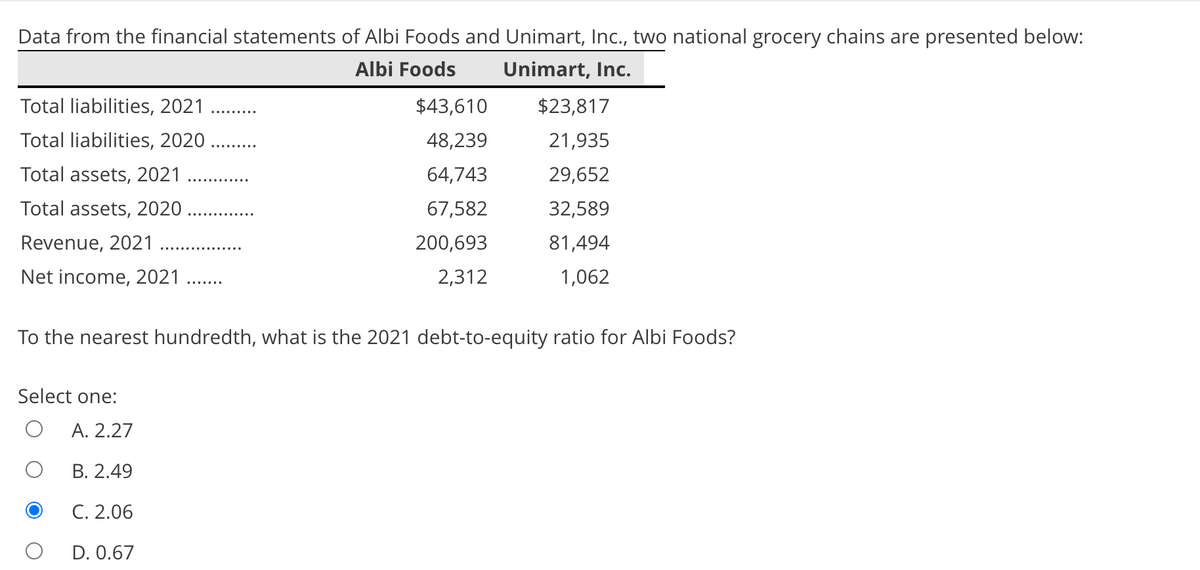
Transcribed Image Text:Data from the financial statements of Albi Foods and Unimart, Ic., two national grocery chains are presented below:
Albi Foods
Unimart, Inc.
Total liabilities, 2021
$43,610
$23,817
Total liabilities, 2020 ..
48,239
21,935
Total assets, 2021
64,743
29,652
Total assets, 2020 ....
67,582
32,589
Revenue, 2021
200,693
81,494
Net income, 2021 ...
2,312
1,062
To the nearest hundredth, what is the 2021 debt-to-equity ratio for Albi Foods?
Select one:
А. 2.27
В. 2.49
С. 2.06
D. 0.67
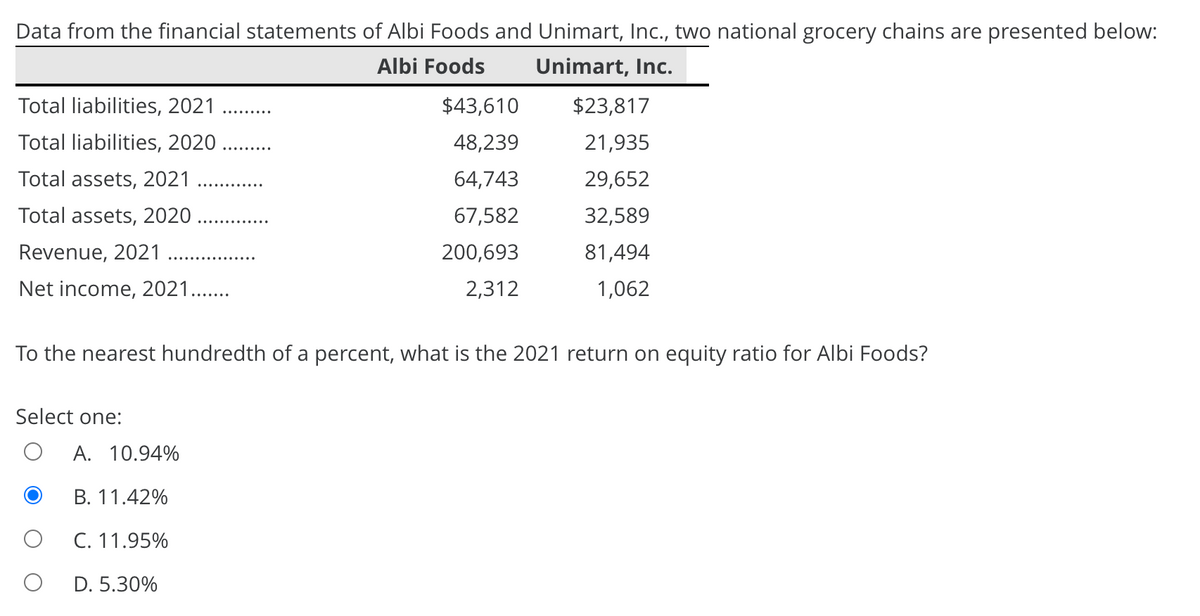
Transcribed Image Text:Data from the financial statements of Albi Foods and Unimart, Inc., two national grocery chains are presented below:
Albi Foods
Unimart, Inc.
Total liabilities, 2021
$43,610
$23,817
Total liabilities, 2020 ..
48,239
21,935
Total assets, 2021
64,743
29,652
Total assets, 2020
67,582
32,589
Revenue, 2021
200,693
81,494
Net income, 2021..
2,312
1,062
To the nearest hundredth of a percent, what is the 2021 return on equity ratio for Albi Foods?
Select one:
A. 10.94%
В. 11.42%
C. 11.95%
D. 5.30%
Expert Solution
This question has been solved!
Explore an expertly crafted, step-by-step solution for a thorough understanding of key concepts.

This is a popular solution!

Trending now
This is a popular solution!

Step by step
Solved in 2 steps with 2 images

Knowledge Booster


Learn more about
Need a deep-dive on the concept behind this application? Look no further. Learn more about this topic, accounting and related others by exploring similar questions and additional content below.Recommended textbooks for you

Accounting
Accounting
ISBN:
9781337272094
Author:
WARREN, Carl S., Reeve, James M., Duchac, Jonathan E.
Publisher:
Cengage Learning,

Accounting Information Systems
Accounting
ISBN:
9781337619202
Author:
Hall, James A.
Publisher:
Cengage Learning,
Accounting
Accounting
ISBN:
9781337272094
Author:
WARREN, Carl S., Reeve, James M., Duchac, Jonathan E.
Publisher:
Cengage Learning,
Accounting Information Systems
Accounting
ISBN:
9781337619202
Author:
Hall, James A.
Publisher:
Cengage Learning,

Horngren's Cost Accounting: A Managerial Emphasis…
Accounting
ISBN:
9780134475585
Author:
Srikant M. Datar, Madhav V. Rajan
Publisher:
PEARSON

Intermediate Accounting
Accounting
ISBN:
9781259722660
Author:
J. David Spiceland, Mark W. Nelson, Wayne M Thomas
Publisher:
McGraw-Hill Education

Financial and Managerial Accounting
Accounting
ISBN:
9781259726705
Author:
John J Wild, Ken W. Shaw, Barbara Chiappetta Fundamental Accounting Principles
Publisher:
McGraw-Hill Education