Data on the fuel economy of several 2010 model vehicles are given in the accompanying table. Complete parts (a) and (b) below. Click the icon to view the table of fuel economy data. *** a) Find and interpret a 95% confidence interval for the gas mileage of 2010 vehicles. Select the correct choice below and fill in the answer boxes within your choice. (Round to two decimal places as needed. Use ascending order.) OA. 95% of all cars like the ones in the sample have gas mileages between mpg and mpg. mpg and mpg. OB. One is 95% confident that the gas mileage of a randomly selected car like the ones in the sample is between OC. One is 95% confident that the true mean gas mileage for cars like the ones in the sample is between OD. The true mean gas mileage for cars like the ones in the sample is between mpg and mpg 95% of the time. mpg and mpg. b) Does this confidence interval capture the mean gas mileage for all 2010 vehicles? Choose the correct answer below. A OA. There is a 95% chance that this interval contains the true mean gas mileage for all 2010 vehicles. OB. Without knowing how the data were selected, one must be cautious about generalizing to all 2010 cars. C. Because the sample size is more than 10% of the population, the inferences drawn from the confidence interval are not valid. Help me solve this View an example Ask my instructor O BI 82°F A G Table of mpg values Car Print 12345678SCHRANK 1289585288888889 9 10 11 mpg 35 40 37 39 31 35 38 33 26 32 38 40 Don 4:41 PM 5/1/2022
Data on the fuel economy of several 2010 model vehicles are given in the accompanying table. Complete parts (a) and (b) below. Click the icon to view the table of fuel economy data. *** a) Find and interpret a 95% confidence interval for the gas mileage of 2010 vehicles. Select the correct choice below and fill in the answer boxes within your choice. (Round to two decimal places as needed. Use ascending order.) OA. 95% of all cars like the ones in the sample have gas mileages between mpg and mpg. mpg and mpg. OB. One is 95% confident that the gas mileage of a randomly selected car like the ones in the sample is between OC. One is 95% confident that the true mean gas mileage for cars like the ones in the sample is between OD. The true mean gas mileage for cars like the ones in the sample is between mpg and mpg 95% of the time. mpg and mpg. b) Does this confidence interval capture the mean gas mileage for all 2010 vehicles? Choose the correct answer below. A OA. There is a 95% chance that this interval contains the true mean gas mileage for all 2010 vehicles. OB. Without knowing how the data were selected, one must be cautious about generalizing to all 2010 cars. C. Because the sample size is more than 10% of the population, the inferences drawn from the confidence interval are not valid. Help me solve this View an example Ask my instructor O BI 82°F A G Table of mpg values Car Print 12345678SCHRANK 1289585288888889 9 10 11 mpg 35 40 37 39 31 35 38 33 26 32 38 40 Don 4:41 PM 5/1/2022

College Algebra (MindTap Course List)
12th Edition
ISBN:9781305652231
Author:R. David Gustafson, Jeff Hughes
Publisher:R. David Gustafson, Jeff Hughes
Chapter8: Sequences, Series, And Probability
Section8.7: Probability
Problem 58E: What is meant by the sample space of an experiment?

Related questions
Question
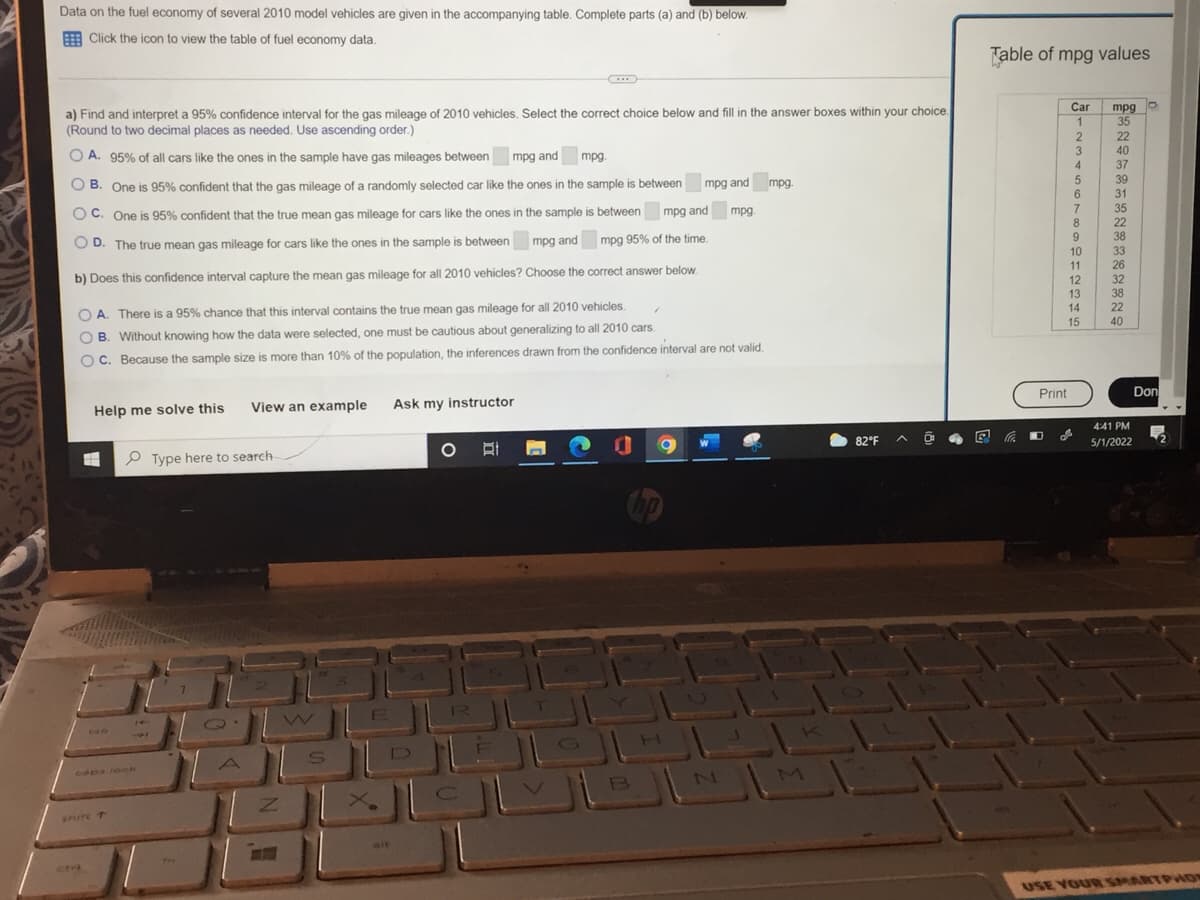
Transcribed Image Text:Data on the fuel economy of several 2010 model vehicles are given in the accompanying table. Complete parts (a) and (b) below.
Click the icon to view the table of fuel economy data.
a) Find and interpret a 95% confidence interval for the gas mileage of 2010 vehicles. Select the correct choice below and fill in the answer boxes within your choice.
(Round to two decimal places as needed. Use ascending order.)
OA. 95% of all cars like the ones in the sample have gas mileages between mpg and mpg.
mpg and mpg.
OB. One is 95% confident that the gas mileage of a randomly selected car like the ones in the sample is between
OC. One is 95% confident that the true mean gas mileage for cars like the ones in the sample is between
D. The true mean gas mileage for cars like the ones in the sample is between mpg and mpg 95% of the time.
mpg and
mpg.
b) Does this confidence interval capture the mean gas mileage for all 2010 vehicles? Choose the correct answer below.
4
OA. There is a 95% chance that this interval contains the true mean gas mileage for all 2010 vehicles.
OB. Without knowing how the data were selected, one must be cautious about generalizing to all 2010 cars.
OC. Because the sample size is more than 10% of the population, the inferences drawn from the confidence interval are not valid.
Help me solve this
View an example Ask my instructor
O
O
=
hp
UUL
DELO
B
shire T
14
9
Type here to search-
TL
Q
S
M
82°F
Table of mpg values
Car mpg o
1
2
3
4
5
6
7
8
9
10
11
12
13
14
15
Print
20
D
គឺខនឧ59នខ ខ ន ន ន ឧ
35
22
40
37
39
31
35
22
38
33
26
32
38
22
Don
4:41 PM
5/1/2022
USE YOUR SMARTPHON
Expert Solution
This question has been solved!
Explore an expertly crafted, step-by-step solution for a thorough understanding of key concepts.

This is a popular solution!

Trending now
This is a popular solution!

Step by step
Solved in 2 steps with 2 images

Recommended textbooks for you
College Algebra (MindTap Course List)
Algebra
ISBN:
9781305652231
Author:
R. David Gustafson, Jeff Hughes
Publisher:
Cengage Learning
College Algebra (MindTap Course List)
Algebra
ISBN:
9781305652231
Author:
R. David Gustafson, Jeff Hughes
Publisher:
Cengage Learning