Data Table n 2 3 4 5 6 7 8 μ= 0.00031 M (g) fexp= 260 2 240 S 5 9 50 9 35 kg/m L= 105 65 2m = 58.4 H₂ 9 M (kg) 0.00031 x 0.973 0.260 Ks 0.240 kg 0-105 ку 0.65 kg 0.50 ks 0.35 kg cm= 200 m M 9.81 T, Mg (N) 2 (cm) 2.548 2.352 1.029 6.37 4.90 3.43 Slope= fexp= Slope height = 19 x 0.27 -6.973 / Vi base 17 * 0.31 Calculation Table 200 cm 100 cm 800 cm 670cm 133 cm 3 570 cm 0.973 / λ (m) 58.4 H₂ 222 =2 1.596 222=1.33 1.533 1 0.8 0.67 √Ts (VN) 0.57 % Error= 1.014 1. Using at least 75% of the graph paper, make a graph with λ on Y axis and √T, on the X axis. 2. Draw a best fit line (a line that doesn't hit any data points but rather goes in between data points) and calculate the slope by picking two points exactly on the best fit line, do not use data points to calculate slope. Show your calculation to get credit. Record the slope of the best fit line in Data Table. 0.798 0.7 3. According to equation (4), A should be linearly proportional to √T, with as a slope. S√√μ Equate your value obtained for slope to and solve for the unknown frequency f. Record this value in Data Table as fexp. S√√μ 0.585
Data Table n 2 3 4 5 6 7 8 μ= 0.00031 M (g) fexp= 260 2 240 S 5 9 50 9 35 kg/m L= 105 65 2m = 58.4 H₂ 9 M (kg) 0.00031 x 0.973 0.260 Ks 0.240 kg 0-105 ку 0.65 kg 0.50 ks 0.35 kg cm= 200 m M 9.81 T, Mg (N) 2 (cm) 2.548 2.352 1.029 6.37 4.90 3.43 Slope= fexp= Slope height = 19 x 0.27 -6.973 / Vi base 17 * 0.31 Calculation Table 200 cm 100 cm 800 cm 670cm 133 cm 3 570 cm 0.973 / λ (m) 58.4 H₂ 222 =2 1.596 222=1.33 1.533 1 0.8 0.67 √Ts (VN) 0.57 % Error= 1.014 1. Using at least 75% of the graph paper, make a graph with λ on Y axis and √T, on the X axis. 2. Draw a best fit line (a line that doesn't hit any data points but rather goes in between data points) and calculate the slope by picking two points exactly on the best fit line, do not use data points to calculate slope. Show your calculation to get credit. Record the slope of the best fit line in Data Table. 0.798 0.7 3. According to equation (4), A should be linearly proportional to √T, with as a slope. S√√μ Equate your value obtained for slope to and solve for the unknown frequency f. Record this value in Data Table as fexp. S√√μ 0.585

Physics for Scientists and Engineers, Technology Update (No access codes included)
9th Edition
ISBN:9781305116399
Author:Raymond A. Serway, John W. Jewett
Publisher:Raymond A. Serway, John W. Jewett
Chapter9: Linear Momentum And Collisions
Section: Chapter Questions
Problem 9.44P: The mass of the blue puck in Figure P9.44 is 20.0% greater than the mass of the green puck. Before...

Related questions

Question
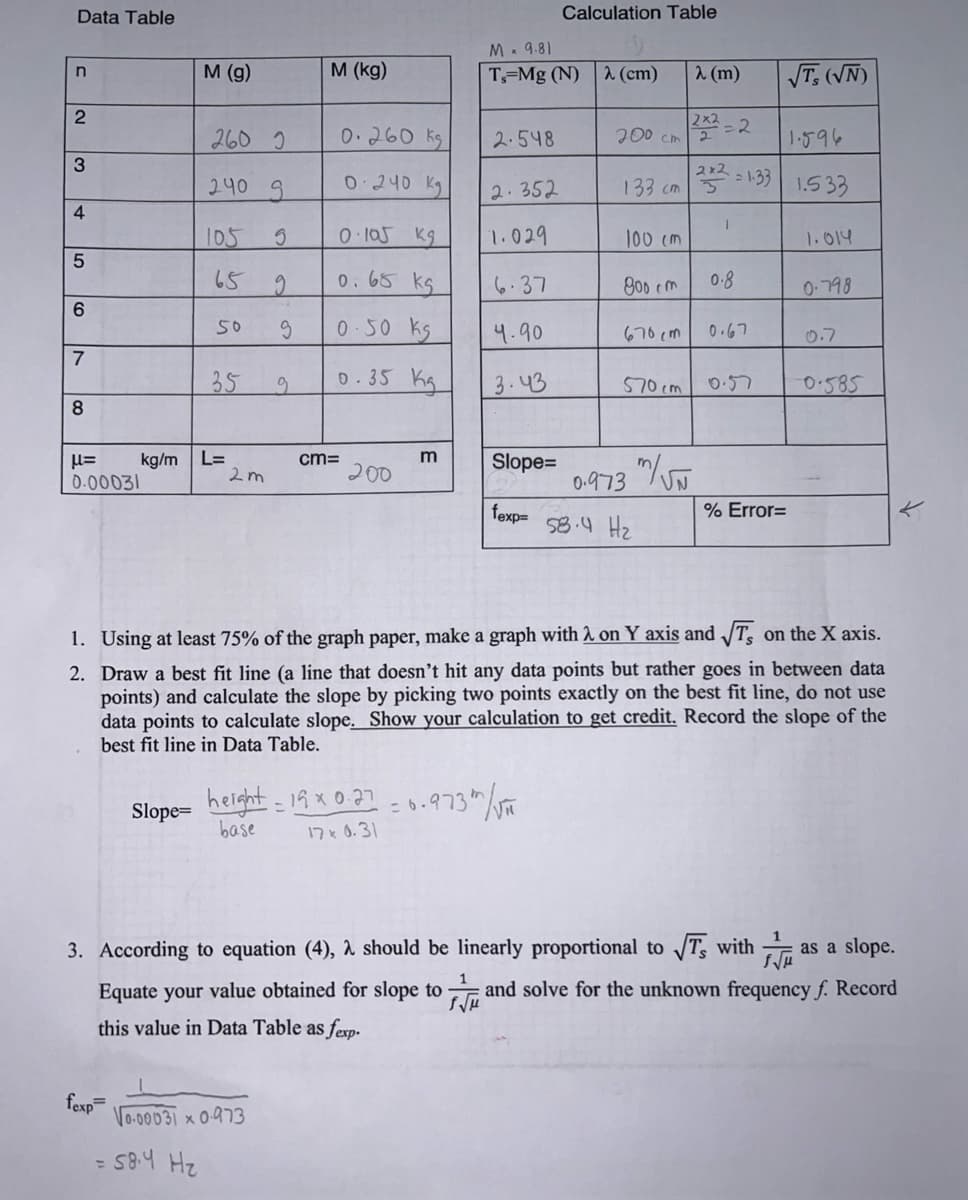
Hello, based on the information provided can you please help me do the % error on the table in the right
Transcribed Image Text:Data Table
n
2
3
4
5
6
7
8
μ=
0.00031
M (g)
kg/m L=
fexp=
260 2
240 9
105 5
65
9
50 9
35
2m
= 58.4 H₂
9
M (kg)
√0.00031 x 0.973
0.260 Ks
0240 kg
0-105 ка
0.65 kg
0.50 ks
0.35 kg
cm=
200
m
M
9.81
T, Mg (N) 2 (cm)
2.548
2.352
1.029
6.37
4.90
3.43
Slope=
fexp=
Slope height = 19 × 0.27 -6.973 / Vi
base
17 x 0.31
Calculation Table
200 cm
100 cm
800 cm
670cm
133 cm 3
570 cm
0.973 /
λ (m)
58.4 H₂
222 =2
1.596
222=1.33 1.533
I
0.8
0.67
√Ts (VN)
0.57
% Error=
1.014
1. Using at least 75% of the graph paper, make a graph with λ on Y axis and √T, on the X axis.
2. Draw a best fit line (a line that doesn't hit any data points but rather goes in between data
points) and calculate the slope by picking two points exactly on the best fit line, do not use
data points to calculate slope. Show your calculation to get credit. Record the slope of the
best fit line in Data Table.
0.798
0.7
3. According to equation (4), A should be linearly proportional to √T, with
as a slope.
S√√μ
Equate your value obtained for slope to and solve for the unknown frequency f. Record
f√μ
this value in Data Table as fexp.
0.585
Expert Solution
This question has been solved!
Explore an expertly crafted, step-by-step solution for a thorough understanding of key concepts.

Step by step
Solved in 5 steps with 4 images

Knowledge Booster


Learn more about
Need a deep-dive on the concept behind this application? Look no further. Learn more about this topic, physics and related others by exploring similar questions and additional content below.Recommended textbooks for you
Physics for Scientists and Engineers, Technology …
Physics
ISBN:
9781305116399
Author:
Raymond A. Serway, John W. Jewett
Publisher:
Cengage Learning

Principles of Physics: A Calculus-Based Text
Physics
ISBN:
9781133104261
Author:
Raymond A. Serway, John W. Jewett
Publisher:
Cengage Learning

Physics for Scientists and Engineers: Foundations…
Physics
ISBN:
9781133939146
Author:
Katz, Debora M.
Publisher:
Cengage Learning
Physics for Scientists and Engineers, Technology …
Physics
ISBN:
9781305116399
Author:
Raymond A. Serway, John W. Jewett
Publisher:
Cengage Learning
Principles of Physics: A Calculus-Based Text
Physics
ISBN:
9781133104261
Author:
Raymond A. Serway, John W. Jewett
Publisher:
Cengage Learning
Physics for Scientists and Engineers: Foundations…
Physics
ISBN:
9781133939146
Author:
Katz, Debora M.
Publisher:
Cengage Learning

Modern Physics
Physics
ISBN:
9781111794378
Author:
Raymond A. Serway, Clement J. Moses, Curt A. Moyer
Publisher:
Cengage Learning