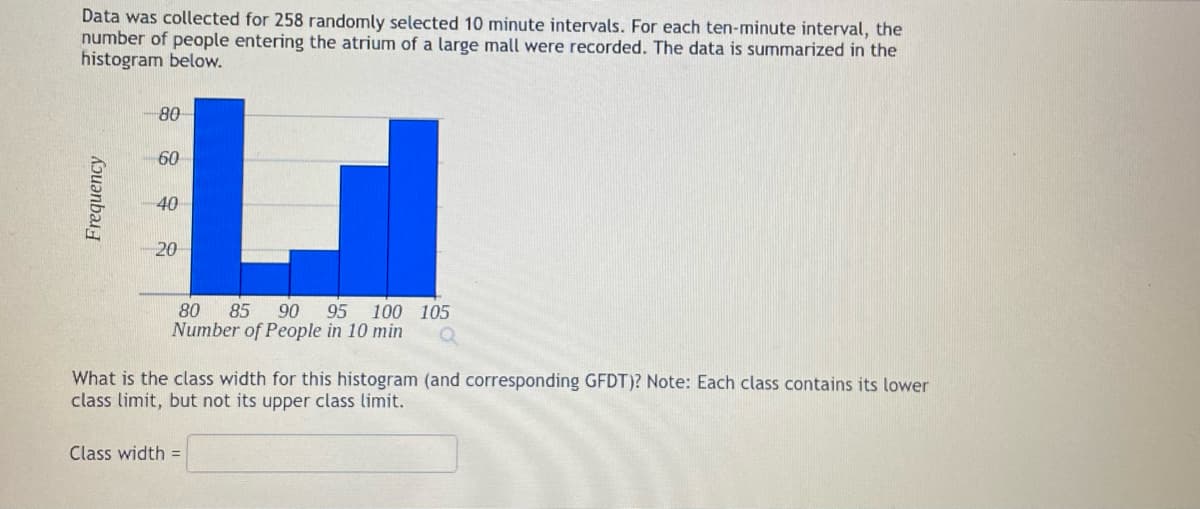
Data was collected for 258 randomly selected 10 minute intervals. For each ten-minute interval, the number of people entering the atrium of a large mall were recorded. The data is summarized in the histogram below. Frequency 80 60 40 20 80 85 90 95 100 105 Number of People in 10 min What is the class width for this histogram (and corresponding GFDT)? Note: Each class contains its lower class limit, but not its upper class limit. Class width =
Data was collected for 258 randomly selected 10 minute intervals. For each ten-minute interval, the number of people entering the atrium of a large mall were recorded. The data is summarized in the histogram below. Frequency 80 60 40 20 80 85 90 95 100 105 Number of People in 10 min What is the class width for this histogram (and corresponding GFDT)? Note: Each class contains its lower class limit, but not its upper class limit. Class width =

Mathematics For Machine Technology
8th Edition
ISBN:9781337798310
Author:Peterson, John.
Publisher:Peterson, John.
Chapter29: Tolerance, Clearance, And Interference
Section: Chapter Questions
Problem 16A: Spacers are manufactured to the mean dimension and tolerance shown in Figure 29-12. An inspector...

Related questions
Question
100%
Transcribed Image Text:Data was collected for 258 randomly selected 10 minute intervals. For each ten-minute interval, the
number of people entering the atrium of a large mall were recorded. The data is summarized in the
histogram below.
Frequency
80
60
40
20
80 85 90 95 100 105
Number of People in 10 min
What is the class width for this histogram (and corresponding GFDT)? Note: Each class contains its lower
class limit, but not its upper class limit.
Class width =
Expert Solution
This question has been solved!
Explore an expertly crafted, step-by-step solution for a thorough understanding of key concepts.

This is a popular solution!

Trending now
This is a popular solution!

Step by step
Solved in 3 steps with 3 images

Recommended textbooks for you
Mathematics For Machine Technology
Advanced Math
ISBN:
9781337798310
Author:
Peterson, John.
Publisher:
Cengage Learning,
Mathematics For Machine Technology
Advanced Math
ISBN:
9781337798310
Author:
Peterson, John.
Publisher:
Cengage Learning,