Data was collected for a sample of organic snacks. The amour summarized in the histogram below. 10 120 140 160 180 200 220 240 260 (Bu) ns fo nenouD What is the sample size for this data set?
Data was collected for a sample of organic snacks. The amour summarized in the histogram below. 10 120 140 160 180 200 220 240 260 (Bu) ns fo nenouD What is the sample size for this data set?

Glencoe Algebra 1, Student Edition, 9780079039897, 0079039898, 2018
18th Edition
ISBN:9780079039897
Author:Carter
Publisher:Carter
Chapter10: Statistics
Section10.5: Comparing Sets Of Data
Problem 1GP

Related questions
Question
How do you find the
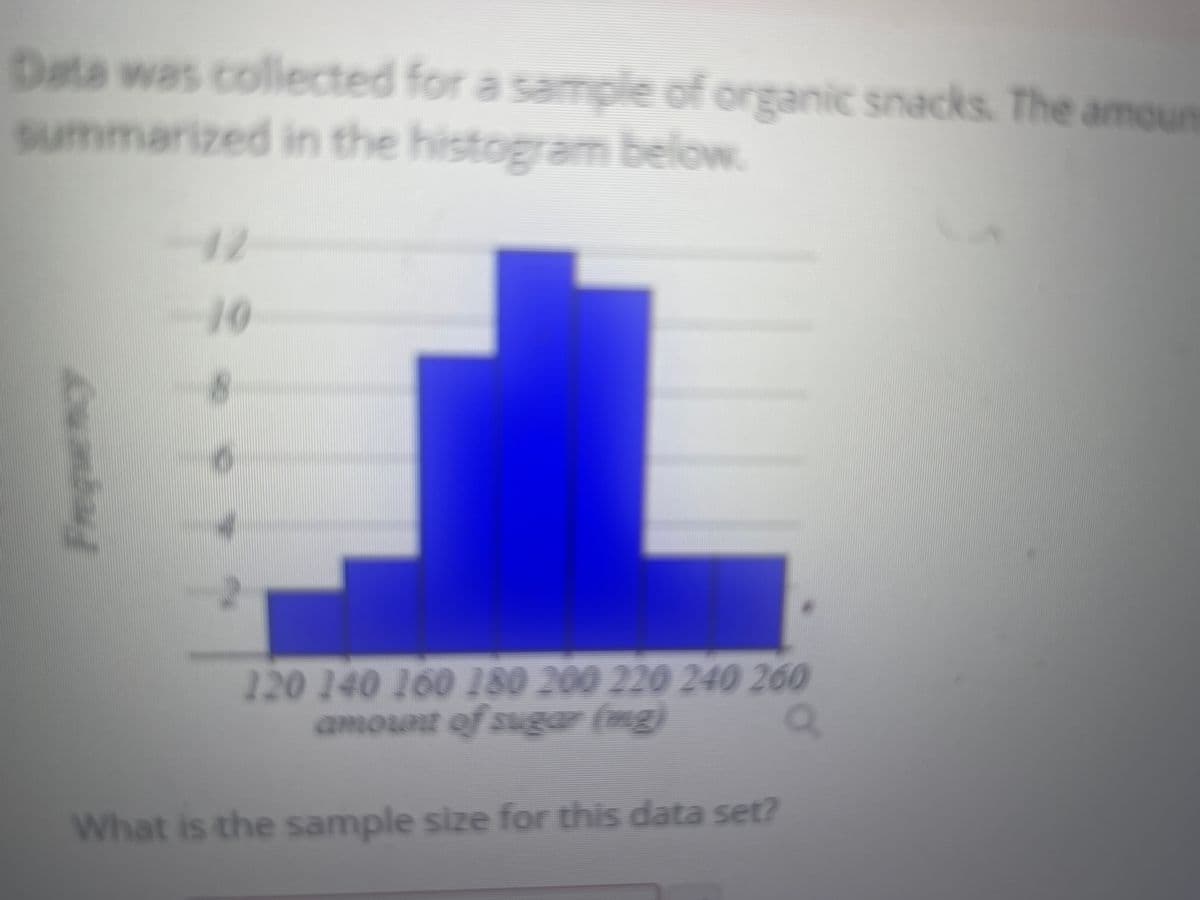
Transcribed Image Text:Data was collected for a sample of organic snacks. The amoun
summarized in the histogram below.
10
120 140 160 180 200 220 240 260
amont of sugar (mg)
What is the sample size for this data set?
Expert Solution
This question has been solved!
Explore an expertly crafted, step-by-step solution for a thorough understanding of key concepts.

Step by step
Solved in 2 steps with 1 images

Recommended textbooks for you
Glencoe Algebra 1, Student Edition, 9780079039897…
Algebra
ISBN:
9780079039897
Author:
Carter
Publisher:
McGraw Hill
Glencoe Algebra 1, Student Edition, 9780079039897…
Algebra
ISBN:
9780079039897
Author:
Carter
Publisher:
McGraw Hill