For the exam scores. Class MT1 MT2 Sample size, n 14 13 Mean scores 75.3 826

Glencoe Algebra 1, Student Edition, 9780079039897, 0079039898, 2018
18th Edition
ISBN:9780079039897
Author:Carter
Publisher:Carter
Chapter10: Statistics
Section10.6: Summarizing Categorical Data
Problem 30PPS

Related questions
Question
Transcribed Image Text:a
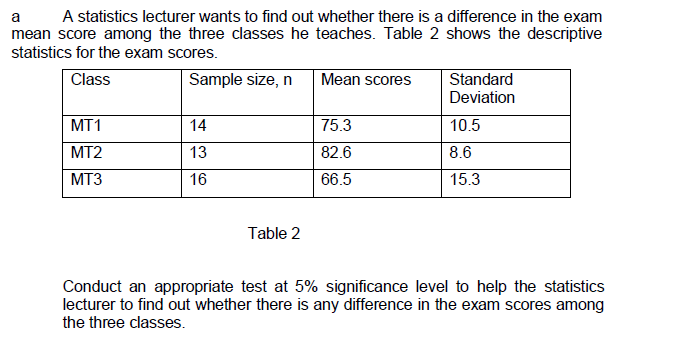
A statistics lecturer wants to find out whether there is a difference in the exam
mean score among the three classes he teaches. Table 2 shows the descriptive
statistics for the exam scores.
Class
Sample size, n
Mean scores
Standard
Deviation
MT1
14
75.3
10.5
MT2
13
82.6
8.6
MT3
16
66.5
15.3
Table 2
Conduct an appropriate test at 5% significance level to help the statistics
lecturer to find out whether there is any difference in the exam scores among
the three classes.
Expert Solution
This question has been solved!
Explore an expertly crafted, step-by-step solution for a thorough understanding of key concepts.

Step by step
Solved in 4 steps

Recommended textbooks for you
Glencoe Algebra 1, Student Edition, 9780079039897…
Algebra
ISBN:
9780079039897
Author:
Carter
Publisher:
McGraw Hill

College Algebra (MindTap Course List)
Algebra
ISBN:
9781305652231
Author:
R. David Gustafson, Jeff Hughes
Publisher:
Cengage Learning
Glencoe Algebra 1, Student Edition, 9780079039897…
Algebra
ISBN:
9780079039897
Author:
Carter
Publisher:
McGraw Hill
College Algebra (MindTap Course List)
Algebra
ISBN:
9781305652231
Author:
R. David Gustafson, Jeff Hughes
Publisher:
Cengage Learning