Dead Zone Volume (10⁹ m³) 7 6 N 1 0 Figure 1: Relationship between nitrogen input and dead zone volume in the Chesapeake Bay 1950-1979 0 ❤ 5 O O O 。 30 Dead Zone Volume (10 m³) 35 7 10 s 1 0 Figure 2: Relationship between nitrogen input and dead zone volume in the Chesapeake Bay 1980-2001 0 10 15 20 25 10 15 20 25 Nitrogen Input (gigagrams per year) Nitrogen Input (gigagrams per year) Data from Hagy, James D., et al. "Hypoxia in Chesapeake Bay, 1950-2001: Long-Term Change in Relation to Nutrient Loading and River Flow." Estuaries, vol. 27, no. 4, 2004, pp. 634-58 5 • Based on Figure 1 and Figure 2, which of the following are accurate statements? There is a positive correlation between nitrogen input and dead zone volume for both time periods There is a negative correlation between nitrogen input and dead zone volume for both time periods There is no correlation between nitrogen input and dead zone volume for both time periods The dead zone was larger on average in 1980-2001 compared to 1950-1979 The dead zone was smaller on average in 1980-2001 compared to 1950-1979 There was no difference in the average size of the dead zone in 1980-2001 compared to 1950-1979 .. : 30 ● 35
Dead Zone Volume (10⁹ m³) 7 6 N 1 0 Figure 1: Relationship between nitrogen input and dead zone volume in the Chesapeake Bay 1950-1979 0 ❤ 5 O O O 。 30 Dead Zone Volume (10 m³) 35 7 10 s 1 0 Figure 2: Relationship between nitrogen input and dead zone volume in the Chesapeake Bay 1980-2001 0 10 15 20 25 10 15 20 25 Nitrogen Input (gigagrams per year) Nitrogen Input (gigagrams per year) Data from Hagy, James D., et al. "Hypoxia in Chesapeake Bay, 1950-2001: Long-Term Change in Relation to Nutrient Loading and River Flow." Estuaries, vol. 27, no. 4, 2004, pp. 634-58 5 • Based on Figure 1 and Figure 2, which of the following are accurate statements? There is a positive correlation between nitrogen input and dead zone volume for both time periods There is a negative correlation between nitrogen input and dead zone volume for both time periods There is no correlation between nitrogen input and dead zone volume for both time periods The dead zone was larger on average in 1980-2001 compared to 1950-1979 The dead zone was smaller on average in 1980-2001 compared to 1950-1979 There was no difference in the average size of the dead zone in 1980-2001 compared to 1950-1979 .. : 30 ● 35

Biology: The Dynamic Science (MindTap Course List)
4th Edition
ISBN:9781305389892
Author:Peter J. Russell, Paul E. Hertz, Beverly McMillan
Publisher:Peter J. Russell, Paul E. Hertz, Beverly McMillan
Chapter54: Ecosystems And Global Change
Section: Chapter Questions
Problem 1ITD

Related questions
Question
100%
Please help with explanation
Transcribed Image Text:L
Dead Zone Volume (10⁰ m³)
0
7
6
1
0
Figure 1: Relationship between nitrogen
input and dead zone volume in the
Chesapeake Bay 1950-1979
0
0
5
........
O
0
30
35
Dead Zone Volume (10 m²)
7
1
0
Figure 2: Relationship between nitrogen
input and dead zone volume in the
Chesapeake Bay 1980-2001
0
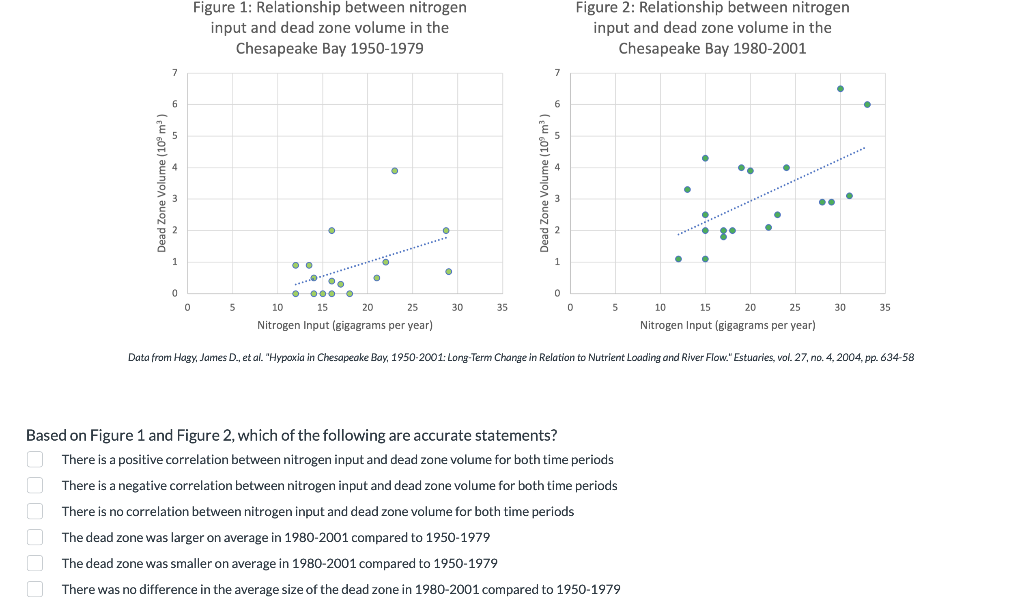
Based on Figure 1 and Figure 2, which of the following are accurate statements?
There is a positive correlation between nitrogen input and dead zone volume for both time periods
There is a negative correlation between nitrogen input and dead zone volume for both time periods
There is no correlation between nitrogen input and dead zone volume for both time periods
The dead zone was larger on average in 1980-2001 compared to 1950-1979
The dead zone was smaller on average in 1980-2001 compared to 1950-1979
There was no difference in the average size of the dead zone in 1980-2001 compared to 1950-1979
5
●
●
10
15
20
25
25
10
15
20
Nitrogen Input (gigagrams per year)
Nitrogen Input (gigagrams per year)
Data from Hagy, James D., et al. "Hypoxia in Chesapeake Bay, 1950-2001: Long-Term Change in Relation to Nutrient Loading and River Flow." Estuaries, vol. 27, no. 4, 2004, pp. 634-58
●
●
●
●
●●
●
30
35
Expert Solution
This question has been solved!
Explore an expertly crafted, step-by-step solution for a thorough understanding of key concepts.

This is a popular solution!

Trending now
This is a popular solution!

Step by step
Solved in 5 steps

Knowledge Booster


Learn more about
Need a deep-dive on the concept behind this application? Look no further. Learn more about this topic, biology and related others by exploring similar questions and additional content below.Recommended textbooks for you
Biology: The Dynamic Science (MindTap Course List)
Biology
ISBN:
9781305389892
Author:
Peter J. Russell, Paul E. Hertz, Beverly McMillan
Publisher:
Cengage Learning
Biology: The Dynamic Science (MindTap Course List)
Biology
ISBN:
9781305389892
Author:
Peter J. Russell, Paul E. Hertz, Beverly McMillan
Publisher:
Cengage Learning