Decide whether the normal sampling distribution can be used. If it can be used, test the claim about the population proportion p at the given level of significance a using the given sample statistics. Claim: p<0.12; a = 0.01; Sample statistics: p= 0.08, n= 25 Can the normal sampling distribution be used? O A. No, because ng is less than 5. O B. No, because np is less than 5. O C. Yes, because pg is greater than a = 0.01. O D. Yes, because both np and ng are greater than or equal to 5. State the null and alternative hypotheses. Choose the correct answer below. O A. Ho: p= 0.12 H, p#0.12
Decide whether the normal sampling distribution can be used. If it can be used, test the claim about the population proportion p at the given level of significance a using the given sample statistics. Claim: p<0.12; a = 0.01; Sample statistics: p= 0.08, n= 25 Can the normal sampling distribution be used? O A. No, because ng is less than 5. O B. No, because np is less than 5. O C. Yes, because pg is greater than a = 0.01. O D. Yes, because both np and ng are greater than or equal to 5. State the null and alternative hypotheses. Choose the correct answer below. O A. Ho: p= 0.12 H, p#0.12

Glencoe Algebra 1, Student Edition, 9780079039897, 0079039898, 2018
18th Edition
ISBN:9780079039897
Author:Carter
Publisher:Carter
Chapter10: Statistics
Section10.4: Distributions Of Data
Problem 19PFA

Related questions

Topic Video
Question
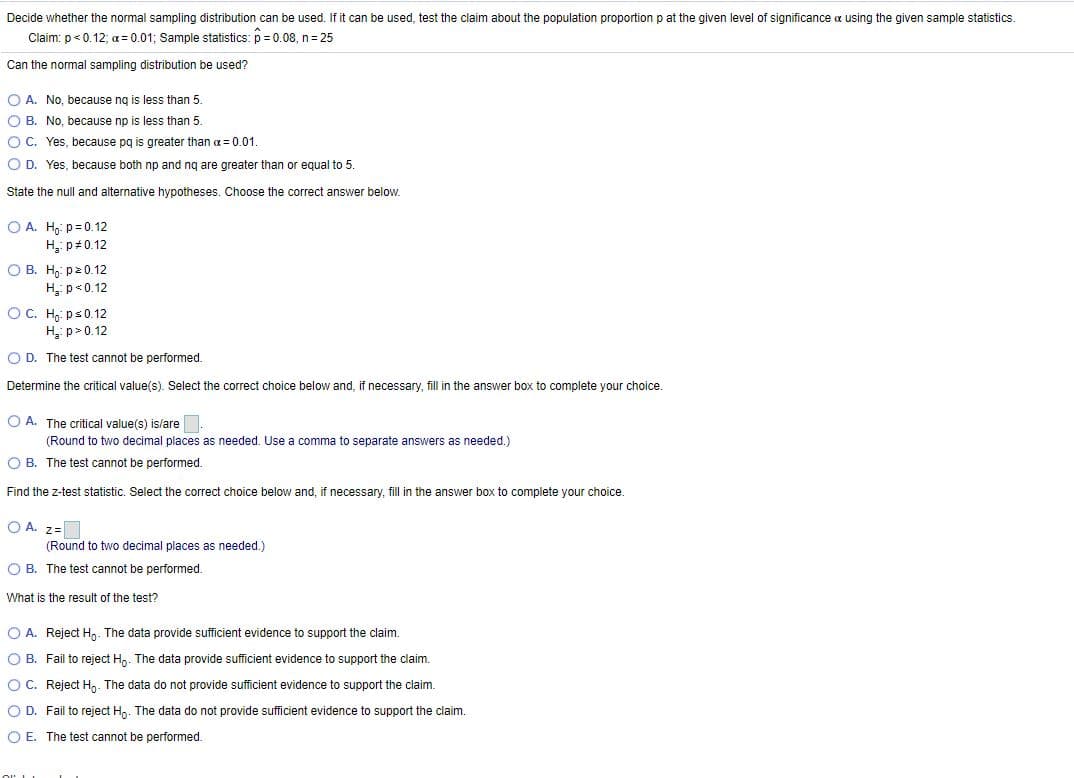
Transcribed Image Text:Decide whether the normal sampling distribution can be used. If it can be used, test the claim about the population proportion p at the given level of significance a using the given sample statistics.
Claim: p< 0.12; a= 0.01; Sample statistics: p = 0.08, n= 25
Can the normal sampling distribution be used?
O A. No, because ng is less than 5.
O B. No, because np is less than 5.
O C. Yes, because pq is greater than a= 0.01.
O D. Yes, because both np and ng are greater than or equal to 5.
State the null and alternative hypotheses. Choose the correct answer below.
O A. H,: p= 0.12
H, p#0.12
O B. Ho: pz0.12
H p<0.12
OC. Hg: ps0.12
H p>0.12
O D. The test cannot be performed.
Determine the critical value(s). Select the correct choice below and, if necessary, fill in the answer box to complete your choice.
O A. The critical value(s) is/are.
(Round to two decimal places as needed. Use a comma to separate answers as needed.)
O B. The test
I be performed.
Find the z-test statistic. Select the correct choice below and, if necessary, fill in the answer box to complete your choice.
O A. z=
(Round to two decimal places as needed.)
O B. The test cannot be performed.
What is the result of the test?
O A. Reject H,. The data provide sufficient evidence to support the claim.
O B. Fail to reject Hn. The data provide sufficient evidence to support the claim.
O C. Reject Hn. The data do not provide sufficient evidence to support the claim.
O D. Fail to reject H,. The data do not provide sufficient evidence to support the claim.
O E. The test cannot be performed.
Expert Solution
This question has been solved!
Explore an expertly crafted, step-by-step solution for a thorough understanding of key concepts.

This is a popular solution!

Trending now
This is a popular solution!

Step by step
Solved in 3 steps with 3 images

Knowledge Booster


Learn more about
Need a deep-dive on the concept behind this application? Look no further. Learn more about this topic, statistics and related others by exploring similar questions and additional content below.Recommended textbooks for you
Glencoe Algebra 1, Student Edition, 9780079039897…
Algebra
ISBN:
9780079039897
Author:
Carter
Publisher:
McGraw Hill
Glencoe Algebra 1, Student Edition, 9780079039897…
Algebra
ISBN:
9780079039897
Author:
Carter
Publisher:
McGraw Hill