Define the null and alternative hypotheses of the x test for the above output. Find the missing values *', **', ****', Showing necessary working What is the degree of freedom for this test? Estimate the p-value for this test. State the conclusion for the test. Give reason for your answer. i. ii. iii. iv. V.
Define the null and alternative hypotheses of the x test for the above output. Find the missing values *', **', ****', Showing necessary working What is the degree of freedom for this test? Estimate the p-value for this test. State the conclusion for the test. Give reason for your answer. i. ii. iii. iv. V.

Glencoe Algebra 1, Student Edition, 9780079039897, 0079039898, 2018
18th Edition
ISBN:9780079039897
Author:Carter
Publisher:Carter
Chapter10: Statistics
Section10.4: Distributions Of Data
Problem 7PPS

Related questions
Topic Video
Question
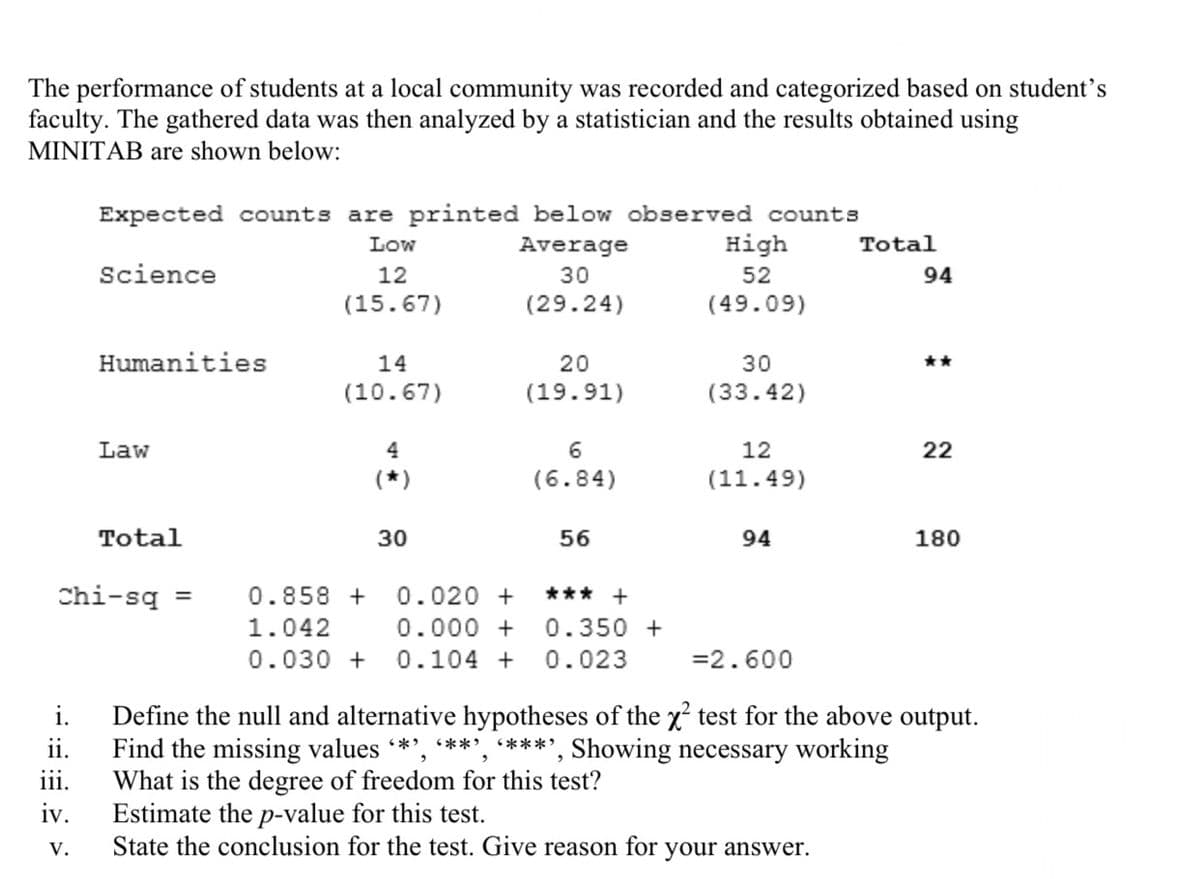
Transcribed Image Text:The performance of students at a local community was recorded and categorized based on student's
faculty. The gathered data was then analyzed by a statistician and the results obtained using
MINITAB are shown below:
Expected counts are printed below observed counts
High
Low
Average
Total
Science
12
30
52
94
(15.67)
(29.24)
(49.09)
Humanities
14
20
30
**
(10.67)
(19.91)
(33.42)
Law
4
6
12
22
(*)
(6.84)
(11.49)
Total
30
56
94
180
Chi-sq
0.858 +
0.020 +
*** +
%3D
1.042
0.000 +
0.350 +
0.030 +
0.104 +
0.023
=2.600
Define the null and alternative hypotheses of the x test for the above output.
Find the missing values *', **', ****', Showing necessary working
What is the degree of freedom for this test?
Estimate the p-value for this test.
State the conclusion for the test. Give reason for your answer.
i.
ii.
iii.
iv.
V.
Expert Solution
This question has been solved!
Explore an expertly crafted, step-by-step solution for a thorough understanding of key concepts.

Step by step
Solved in 4 steps

Knowledge Booster


Learn more about
Need a deep-dive on the concept behind this application? Look no further. Learn more about this topic, statistics and related others by exploring similar questions and additional content below.Recommended textbooks for you
Glencoe Algebra 1, Student Edition, 9780079039897…
Algebra
ISBN:
9780079039897
Author:
Carter
Publisher:
McGraw Hill

College Algebra (MindTap Course List)
Algebra
ISBN:
9781305652231
Author:
R. David Gustafson, Jeff Hughes
Publisher:
Cengage Learning
Glencoe Algebra 1, Student Edition, 9780079039897…
Algebra
ISBN:
9780079039897
Author:
Carter
Publisher:
McGraw Hill
College Algebra (MindTap Course List)
Algebra
ISBN:
9781305652231
Author:
R. David Gustafson, Jeff Hughes
Publisher:
Cengage Learning