
Case Studies In Health Information Management
3rd Edition
ISBN:9781337676908
Author:SCHNERING
Publisher:SCHNERING
Chapter1: Data Content, Structure, And Standards
Section: Chapter Questions
Problem 1.12.3C

Related questions
Question
100%
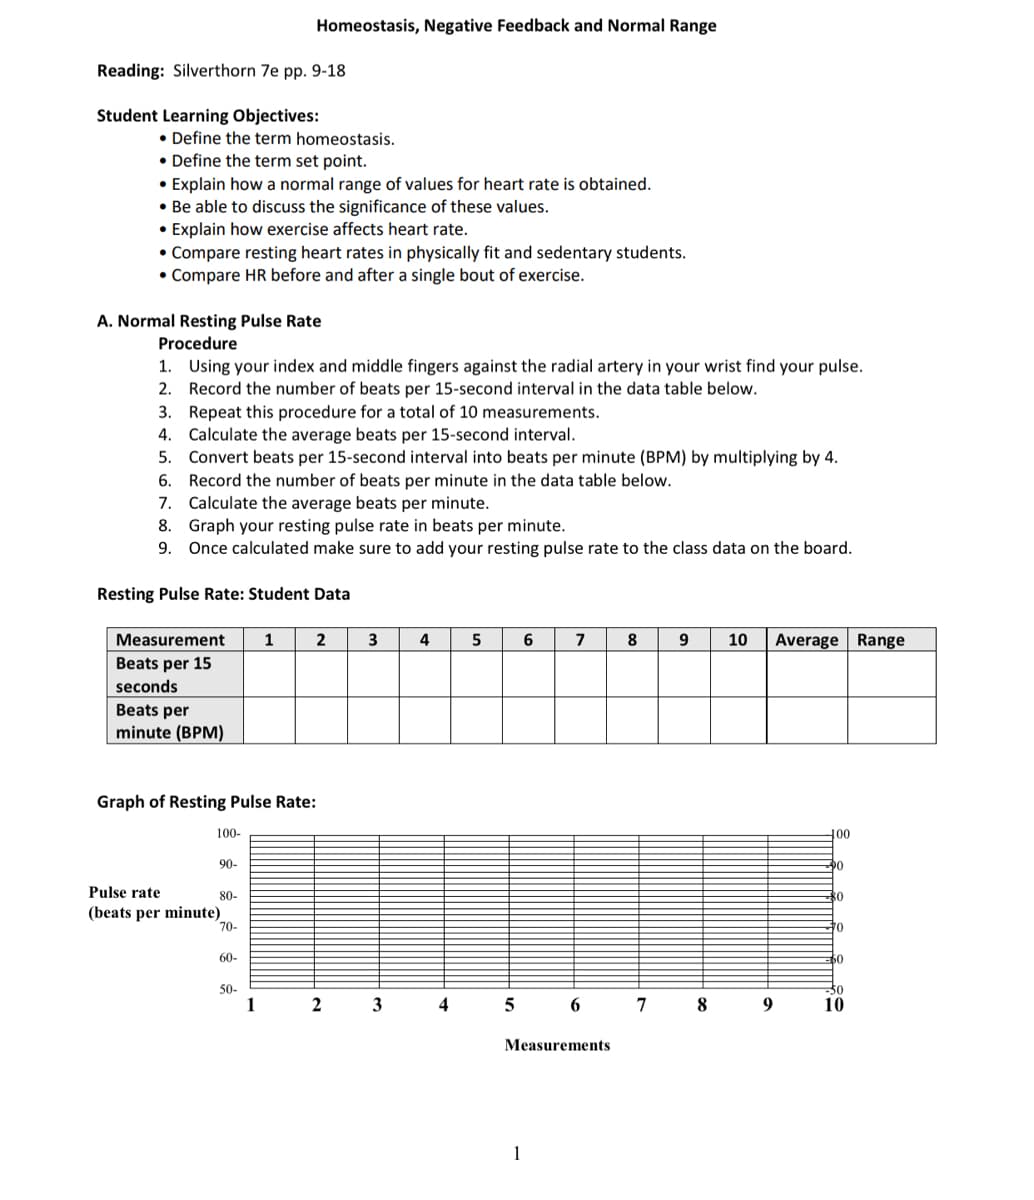
Transcribed Image Text:Homeostasis, Negative Feedback and Normal Range
Reading: Silverthorn 7e pp. 9-18
Student Learning Objectives:
• Define the term homeostasis.
• Define the term set point.
• Explain how a normal range of values for heart rate is obtained.
• Be able to discuss the significance of these values.
• Explain how exercise affects heart rate.
• Compare resting heart rates in physically fit and sedentary students.
• Compare HR before and after a single bout of exercise.
A. Normal Resting Pulse Rate
Procedure
1. Using your index and middle fingers against the radial artery in your wrist find your pulse.
2. Record the number of beats per 15-second interval in the data table below.
3. Repeat this procedure for a total of 10 measurements.
4. Calculate the average beats per 15-second interval.
Convert beats per 15-second interval into beats per minute (BPM) by multiplying by 4.
6. Record the number of beats per minute in the data table below.
7. Calculate the average beats per minute.
8. Graph your resting pulse rate in beats per minute.
9. Once calculated make sure to add your resting pulse rate to the class data on the board.
5.
Resting Pulse Rate: Student Data
8 9
Average Range
Measurement
1
2
3
4
7
10
Beats per 15
seconds
Beats per
minute (BPM)
Graph of Resting Pulse Rate:
100-
100
90-
Pulse rate
80-
80
(beats per minute)
70-
to
60-
50
30
10
50-
1
3
4
5 6
7
8
Measurements
Expert Solution
This question has been solved!
Explore an expertly crafted, step-by-step solution for a thorough understanding of key concepts.

This is a popular solution!

Trending now
This is a popular solution!

Step by step
Solved in 3 steps

Knowledge Booster


Learn more about
Need a deep-dive on the concept behind this application? Look no further. Learn more about this topic, biology and related others by exploring similar questions and additional content below.Recommended textbooks for you
Case Studies In Health Information Management
Biology
ISBN:
9781337676908
Author:
SCHNERING
Publisher:
Cengage
Case Studies In Health Information Management
Biology
ISBN:
9781337676908
Author:
SCHNERING
Publisher:
Cengage