del Normal P-P Plot of Regression Standardized Residual Dependent Variable CallensPer100Mes Expected Cam Prob La Regression Residual Observed Cum Prob Sum of Squares A ANOVA df 848.363 2 240.325 389 1088.688 391 Regression Standardized Residual F 424.182 686.598 .618 Mean Square Total a. Dependent Variable: GallonsPer100Miles h. Predictors (Constant), Hores Power of the Engine, Number of cylinders Sig. .000 Dependent **** *** Regression Standardized Predicted Value
del Normal P-P Plot of Regression Standardized Residual Dependent Variable CallensPer100Mes Expected Cam Prob La Regression Residual Observed Cum Prob Sum of Squares A ANOVA df 848.363 2 240.325 389 1088.688 391 Regression Standardized Residual F 424.182 686.598 .618 Mean Square Total a. Dependent Variable: GallonsPer100Miles h. Predictors (Constant), Hores Power of the Engine, Number of cylinders Sig. .000 Dependent **** *** Regression Standardized Predicted Value

Functions and Change: A Modeling Approach to College Algebra (MindTap Course List)
6th Edition
ISBN:9781337111348
Author:Bruce Crauder, Benny Evans, Alan Noell
Publisher:Bruce Crauder, Benny Evans, Alan Noell
Chapter3: Straight Lines And Linear Functions
Section3.CR: Chapter Review Exercises
Problem 16CR: XYZ Corporation Stock Prices The following table shows the average stock price, in dollars, of XYZ...

Related questions
Question
How should interpret assumptions of the technique used?
Based on the tables and charts presented below, interpret the results and report your answer with an academic style. You should interpret assumptions of the technique used.
Transcribed Image Text:Model
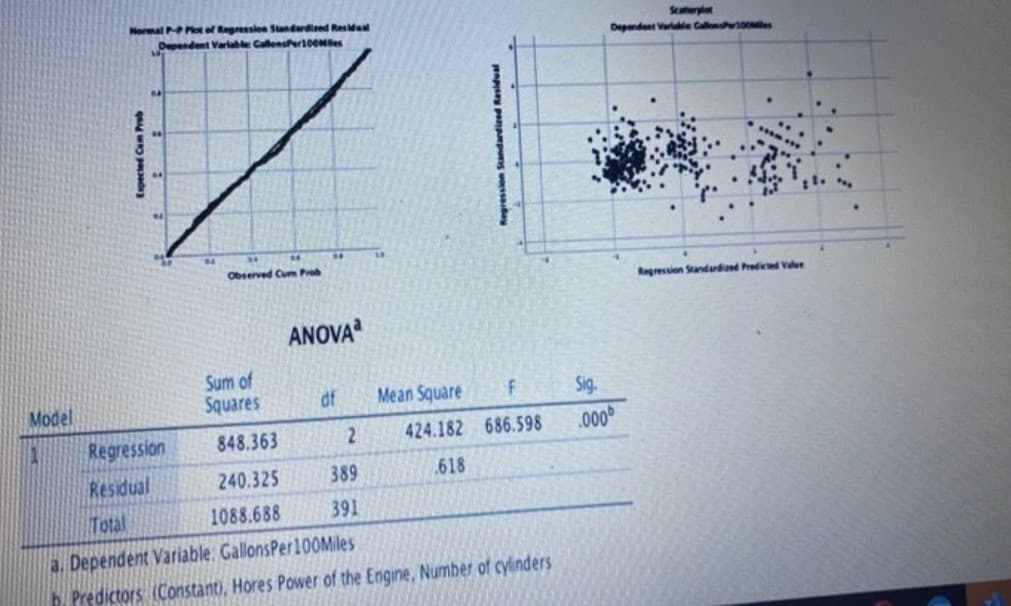
Normal P-P Plot of Regression Standardized Residual
Dependent Variable CallonsPer100Mes
Regression
Residual
Observed Cum Prob
Sum of
Squares
ANOVA
df
848.363
2
240.325
389
1088.688 391
F
424.182 686.598
.618
Mean Square
Total
Dependent Variable, GallonsPer100Miles
h. Predictors (Constant), Hores Power of the Engine, Number of cylinders
Sig.
.000
Dependent Variable CallionsPer100Miles
Regression Standardized Predicted Vale
Transcribed Image Text:Pearson
Correlation
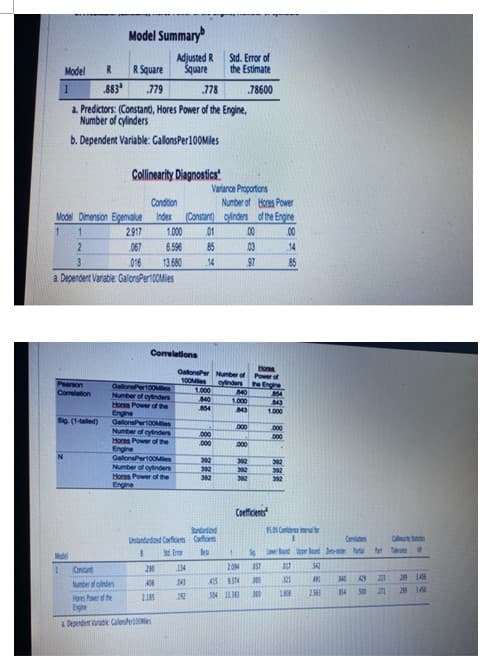
Model Summary
R
R Square
.883 .779
Model
1
.778
a. Predictors: (Constant), Hores Power of the Engine,
Number of cylinders
b. Dependent Variable: GallonsPer100Miles
Model Dimension Eigenvalue
1 1
2.917
Sig (1-tailed)
Model
2
3
a. Dependent Variable: GallonsPer 100Mies
Collinearity. Diagnostics
067
016
Contar
Number of cinders
Hores Power of the
Engine
a Dependent variable Calen
Adjusted R
Square
Condition
Number of Hores Power
Index (Constant) cylinders of the Engine
1.000 01
00
14
85
GallonaPer100Men
Number of cylinders
Hores Power of the
Engine
6.596 85
13.680
14
Correlations
GallonsPer100Miles
Number of cylinders
Hors Power of the
Engine
GallonsPer100Miles
Number of cylinders
Hores Power of the
Engine
280
406
2.185
GalonsPer
100M
Unstandardand Coefficients
1 Std. Ervar
134
14
192
1.000
840
854
*** 88.
000
392
392
Std. Error of
the Estimate
78600
Variance Proportions
392
Number of
cylinders
Standarded
Cafficers
ka
00
03
97
140
1.000
343
000
000
392
392
392
1
2.094
415 9.374
504 11.343
Hores
Power of
the Engine
Coefficients
854
843
1.000
000
000
302
392
302
95.5 Confidence alo
Slow Round pe lund -ade
37
000
000
317
321
1808
542
491 140 429
2.563
814
500
Pot T
221
271
219 1458
2014
Expert Solution
This question has been solved!
Explore an expertly crafted, step-by-step solution for a thorough understanding of key concepts.

Step by step
Solved in 2 steps

Recommended textbooks for you
Functions and Change: A Modeling Approach to Coll…
Algebra
ISBN:
9781337111348
Author:
Bruce Crauder, Benny Evans, Alan Noell
Publisher:
Cengage Learning

College Algebra
Algebra
ISBN:
9781305115545
Author:
James Stewart, Lothar Redlin, Saleem Watson
Publisher:
Cengage Learning

Algebra and Trigonometry (MindTap Course List)
Algebra
ISBN:
9781305071742
Author:
James Stewart, Lothar Redlin, Saleem Watson
Publisher:
Cengage Learning
Functions and Change: A Modeling Approach to Coll…
Algebra
ISBN:
9781337111348
Author:
Bruce Crauder, Benny Evans, Alan Noell
Publisher:
Cengage Learning
College Algebra
Algebra
ISBN:
9781305115545
Author:
James Stewart, Lothar Redlin, Saleem Watson
Publisher:
Cengage Learning
Algebra and Trigonometry (MindTap Course List)
Algebra
ISBN:
9781305071742
Author:
James Stewart, Lothar Redlin, Saleem Watson
Publisher:
Cengage Learning