Demand 7 9 5 11 10 13 The least squares regression equation that shows the best relationship between demand and period is (round your responses to two decimal places): where y = Demand and x = Period.


Q: Sycamore Plastics (SP) is a manufacturer of polyethylene plastic pellets used es a row material by m...
A: Unit transportation cost and demand supply Combined costs per 1000 l...
Q: Which of the following best completes this sentence? The goal of quality control is to create defec...
A: Quality assurance is all the planned and systematic activities executed within the quality system th...
Q: Which of the three skills that exceptional managers need did the Changs most lack? Explain your answ...
A: Managers are individuals who operate in variety of fields and do different types of tasks. The prime...
Q: a.What is Maxantene Products economic order quantity for this input? b. What is Maxantene Products'...
A: Economic order quantity is the optimal order quantity that any business should purchase so that thei...
Q: The chart below shows the initial investment and expected yearly payback for Project A and Project B...
A: A Small Introduction about Investment A venture is basically a resource that is made fully intent...
Q: Break Even is defined as Revenue = Tolal Cost What is the quantity of toys that must be sold to brea...
A:
Q: What are the risk-mitigating strategy for following risk in the company loss of physical assets los...
A: A Small Introduction about Strategy of a Company A methodology is a drawn-out arrangement that yo...
Q: Figure 1 shows the BOM for product A. Table 1 shows the MPS quantity start dates for product A, and ...
A: Note: For a given week Scheduled receipt and Beginning inventory are treated differently. But once t...
Q: A granite producer manufactures 92000 units of glass black granite slate in which the use of labour ...
A: given: Total units Produced = 92,000 units Labour input = Rs. 23,000 Capital input = Rs. 15009 to ...
Q: What are the options for the production planner who has:a) scheduled more than capacity in a work ce...
A: Production planning is the planning of production and manufacturing modules in a business or industr...
Q: As an approach to inventory management, how does MRP differ from the approach taken, dealing witheco...
A: Production is the process of manufacturing the finished products for the customers using raw materia...
Q: Tech, with a student population of 30,000, is located in a small college town in Virginia. DirectCas...
A: City Representation Richmond R Charlotte C Atlanta A Greensboro G DC DC Nashville N No...
Q: Which of the following product flow types are characterized by high skill level? Continuous O Job sh...
A: Job shop uses general-purpose equipment and depends on the knowledge and skill of the workers. So, t...
Q: To connect with critical customers and suppliers, many large firms employ electronic data interchang...
A: EDI or Electronic Data Interchange is described as a technology that allows organizations and tradin...
Q: The quality tool cause-and-effect diagram _____ of the fish represents quality problem and _____ of ...
A: The fish-born diagram of the quality tool is a fish-shaped layout that shows the problem and its rea...
Q: a. Customer dynamics arise from what 5 sources (describe each)? b. Explain the 3 approaches to m...
A: Note: “Since you have posted a question with multiple sub-parts, we will solve the first three sub-p...
Q: How are globally outsourced IT projects reliant on technology for virtual project management?
A: Historically, effective project management teams have been comprised of individuals who have previou...
Q: Is Amazon Web Services an ERP system?
A: When practically all significant suppliers have opted to aggressively shift to the cloud, replacing ...
Q: Kpogas produces chairs and tables. Using economic forecast for the next month, Kpogas’ marketing man...
A: given, Kpogas’s unit contribution margin is GH¢ 5,000 on each chair sold and GH¢ 4,000 on each table...
Q: There are 3 different fire alarm systems in the store. System A detects fire with a probability of 0...
A: In the question, we could see that there are three different fire alarm systems, these systems are s...
Q: Assess the impact of this situation on business performance and management decision making.
A: Given the fact that Synders works at a very large scale globally, it will have massive data collecti...
Q: Radiant wants to hire planes to transport three types of goods- A, B, and C. They contacted VIP Tran...
A: Given data is Cost of WT88 = $2800 Cost of BH54 = $1200 Transportation of good A = 500 tons Transpo...
Q: analyze the Benchmaking concept on the implementation and formulation of social policy
A: Benchmarking is a concept in which the existing firms tries to benchmark or copy the same strategic ...
Q: Understanding and predicting inventory obsolescence is an important determination for retal companie...
A: Inventory management is described as the process through which orders are placed, products are sold,...
Q: --- has advantage of bringing efficiencies of product layout to process layout a. Cellular Layout b....
A: Hybrid layouts integrate process and product layout traits. They are built wherever feasible to blen...
Q: How does MRP II differ from MRP?
A: A Material Requirements Planning often called MRP framework can be stated as the planning and decisi...
Q: a) Using simple linear regression, the forecast for the number of disk drives to be made next year =...
A: In this question, for each year, I have disk drives data, using the Ms Excel software, I have determ...
Q: BETTER PRODUCTS COMPANY has decided to start manufacturing four new products in three plants that cu...
A: Total number of supply constraints : 3Total number of demand constraints : 4Problem Table is D...
Q: Your hospital has built a new freestanding facility that includes a 36-bed medical telemetry care un...
A: A Small Introduction about Productivity Productivity is the proportion between the result of rich...
Q: Discuss the process of defining project scope in more detail as a project progresses, going from inf...
A: The scope is basically all the work that should be done in a request to achieve a project's goals. I...
Q: Operations Management 1. An Enterprise resource-planning system helps a company? a. Find new low cos...
A: Customer relationship management is described as the management of a company's interactions and rela...
Q: How may formative scales be used to examine the possibility of a cross-level moderati
A: formative measurement classical occurs when the measured variables are deliberated to be the reason ...
Q: three-period moving average. A weighted average using weights of .50 (most recent), .20 and .30. Exp...
A: forecasting is a method which helps to predict the unknown future based on the known past informatio...
Q: Organizations today operate in an environment of rapid, continuous change. How will you use “Greiner...
A: Greiner model constitutes of Time factor as it is variable in nature. Alterations in any organisatio...
Q: you are the Risk Manager of Barings Futures Singapore (BFS), discuss the potential risk mitigation t...
A: Introduction about forecasting Forecasting is done to comprehend the interest that might emerge lat...
Q: The pipeline has approximately 100 companies, as compared to the motor carrier industry with more th...
A: Motor carrier can be referred to a vehicle which can be utilised to carry products from one place to...
Q: Your stockroom manager, Mehmet Altag, arrivedat your desk just a fter you had completed the net requ...
A: We’ll answer the first question since the exact one wasn’t specified. Please submit a new question s...
Q: 2. a. Develop a linear trend line for the following data. (Solve manually, using Minitab and using E...
A: Note: “Since you have posted a question with multiple sub-parts, we will solve the first three sub-p...
Q: What are the typical steps in the new offering development process? Describe the key activities that...
A: As per Bartleby's guidelines, we only solve the first question in case multiple questions are asked ...
Q: Daily Subway and Bus Use in Five Major C 0.75 0.5 0.25 gapore ez Kong ondon Tokyo v York
A: 1 b ) are unusually reliant on buses 2 c) it began to rebound after 1990
Q: ow much would the minimum total annual inventory-related costs that JJ would incur if it applies the...
A: EOQ stands for Economic order quantity, and at EOQ level the cost of inventory remains lowest, sugge...
Q: Which is NOT a characteristic of a service? Group of answer choices a. Services are intangible b. ...
A: Services are intangible and cannot be stored for further use it can be used at a time when it is due...
Q: a. Determine the number of followers for each task.
A: number of following task indicating the total number of possible following task for each activity. H...
Q: Compare and contrast the ABC and VED analysis that are carried out in stores of the hospital
A: A decent stock control will uphold and speed up the accessibility of medication administrations gave...
Q: What is the probability that no cars are in the system? What is the average number of cars waiting f...
A: Service rate is the rate at which the customers are being served by the worker in the organizational...
Q: Thinking about the hotel industry, I'm wondering does the hotels use long run pricing or short run p...
A: Pricing is clearly crucial in any consumer business, but it is especially critical in industries lik...
Q: Wevcc roots makes Bottles of premium root juices , it has one production line which can produce a ma...
A: Actual output = 73,42,721 bottles Potential output= 71,00,000 bottles
Q: In terms of process quality ____ relates to the manufacturer / service provider fulfilling their pro...
A: Manufacturing organizations have traditionally struggled to fulfill consumer expectations while also...
Q: Traditional management verses Modern Management and give example of any three
A: A Small Introduction about Management Management is the fulfillment of organizational objectives ...
Q: carately on hand. Assess the business impact of this situation, describe how this process could be i...
A: As per the Bartleby guidelines, only the first question has been answered.
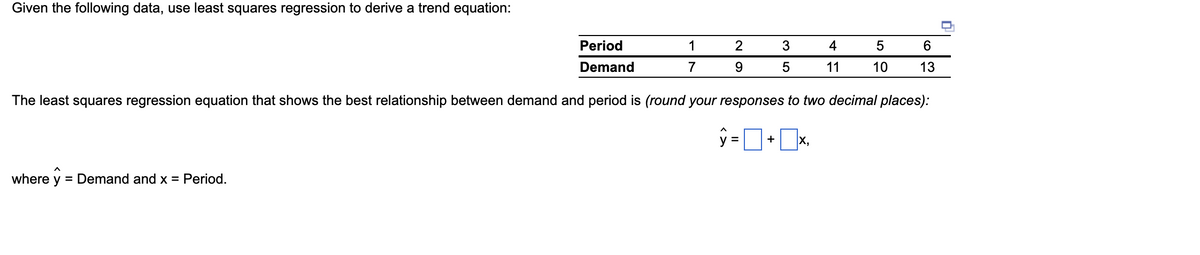
To get the relationship between demand and period, here, first, I would determine the intercept and slope values, the least square forecast equation would be = (Intercept + (slope*period or t)
or we could write as the forecast of the demand data= (Intercept + (slope*period)
These Intercept and slope are calculated using the excel formula and I have shown in the next section.

Trending now
This is a popular solution!

Step by step
Solved in 2 steps with 5 images

- Sometimes curvature in a scatterplot can be fit adequately (especially to the naked eye) by several trend lines. We discussed the exponential trend line, and the power trend line is discussed in the previous problem. Still another fairly simple trend line is the parabola, a polynomial of order 2 (also called a quadratic). For the demand-price data in the file P13_10.xlsx, fit all three of these types of trend lines to the data, and calculate the MAPE for each. Which provides the best fit? (Hint: Note that a polynomial of order 2 is still another of Excels Trend line options.)The Baker Company wants to develop a budget to predict how overhead costs vary with activity levels. Management is trying to decide whether direct labor hours (DLH) or units produced is the better measure of activity for the firm. Monthly data for the preceding 24 months appear in the file P13_40.xlsx. Use regression analysis to determine which measure, DLH or Units (or both), should be used for the budget. How would the regression equation be used to obtain the budget for the firms overhead costs?Stock market analysts are continually looking for reliable predictors of stock prices. Consider the problem of modeling the price per share of electric utility stocks (Y). Two variables thought to influence this stock price are return on average equity (X1) and annual dividend rate (X2). The stock price, returns on equity, and dividend rates on a randomly selected day for 16 electric utility stocks are provided in the file P13_15.xlsx. Estimate a multiple regression equation using the given data. Interpret each of the estimated regression coefficients. Also, interpret the standard error of estimate and the R-square value for these data.
- Given the following data, use least-squares regression to derive a trend equation: Period 1 2 3 4 5 6 Demand 6 7 10 11 9 15 The least-squares regression equation that shows the best relationship between demand and period is (round your responses to two decimal places): y=nothing+nothingx, where y=Demand and x=Period.Sales of Volkswagens have grown steadily at auto dealerships in Nevada during the past 5 years (see table below). Year Sales 1 460 2 502 3 518 4 575 5 580 Part 2 a) Forecasted sales for year 6 using the trend projection (linear regression) method are enter your response here sales (round your response to one decimal place).Answer in Excel: Consider the data below for the sales of widgets: 1. Using seasonal percentages or seasonal indexes, forecast the sales for each season in year 4, if the annual widgets sales is predicted to be 1500. 2. Develop a regression equation that captures both the trend and seasonality in this data. Use this equation to forecast the sales for each season in year 4. Season Year 1 Year 2 Year 3 Fall 505 240 210 Winter 555 460 365 Spring 400 310 204 Summer 560 450 394
- Sales of Volkswagen's popular Beetle have grown steadily at auto dealerships in Nevada during the past 5 years (see table below). Year Sales 1 455 2 510 3 518 4 570 5 590 a) Forecasted sales for year 6 using the trend projection (linear regression) method are nothing sales (round your response to one decimal place)Sales over the past 10 years are shown below. Using the method of least squares, calculate the values of a and b to complete this regression equation. Year Sales 1 1770 2 1880 3 1070 4 1420 5 1540 6 2000 7 1910 8 1360 9 1400 10 1500 (Indicate a negative answer using a "-" sign. Do not round intermediate calculations and round your final answer to 3 decimal places.) What is your forecast for next year’s sales? (Do not round intermediate calculations and round your final answer to 2 decimal places.)Cell phone sales for a California-based firm over the last 10 weeks are shown in the following table. Plot the data, and visually check to see if a linear trend line would be appropriate.Then determine the equation of the trend line, and predict sales for weeks 11 and 12.Week Unit Sales1 7002 7243 7204 7285 7406 7427 7588 7509 77010 775
- Sales of Volkswagen's popular Beetle have grown steadily at auto dealerships in Nevada during the past 5 years (see table below). Year Sales 1 455 2 510 3 518 4 570 5 590 a) Forecasted sales for year 6 using the trend projection (linear regression) method are 627.6627.6 sales (round your response to one decimal place). b) The MAD for a linear regression forecast is nothing sales (round your response to one decimal place).Sales over the past 10 years are shown below. Using the method of least squares, calculate the values of a and b to complete this regression equation. Year Sales 1 1,640 2 1,850 3 1,240 4 1,250 5 1,980 6 1,400 7 1,060 8 1,430 9 1,050 10 1,990 (Indicate a negative answer using a "-" sign. Do not round intermediate calculations and round your answer to 3 decimal places.) What is your forecast for next year's sales? (Do not round intermediate calculations and round your answer to 2 decimal places.)Create a line graph for this set of monthly sales numbers. Run a regression analysis. What is the regression equation? Is the regression equation significant? How can you tell? What is the Rsquare? What does this signify? What is the sales forecast for month 13? 1 550 2 548 3 546 4 549 5 550 6 548 7 551 8 551 9 552 10 551 11 553 12 553
