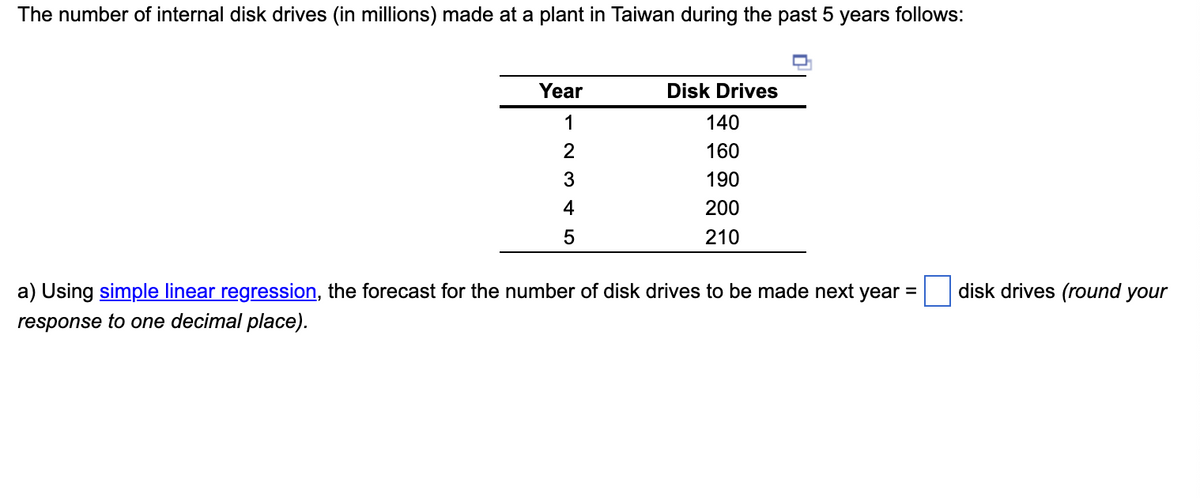
a) Using simple linear regression, the forecast for the number of disk drives to be made next year = disk drives (round your response to one decimal place).


Q: You have a new job as a Financial Planning assistant. Your client wants to invest money in stocks, b...
A: S = Total dollars invested in stocks B = Total dollars invested in Bonds T = Total dollars invested ...
Q: rove the company productivity. b) Analyse at least THREE possible strategies that company may use to...
A: How to Increase Organizational Productivity
Q: ow much would the minimum total annual inventory-related costs that JJ would incur if it applies the...
A: EOQ stands for Economic order quantity, and at EOQ level the cost of inventory remains lowest, sugge...
Q: Using the information in Problem (The demand for subassembly Sis 100 units in week 7.Each unit ofS r...
A: A Small Introduction about Manufacturing Management Similar to creation management, manufacturing...
Q: How does this forecast differ from that using employment as the independent variable? What is the co...
A: The data can be arranged in excel sheet in order to run a regression.
Q: Discuss the aims and objectives of Strategic Environmental Assessment (SEA)
A: Strategic Environmental Assessment (SEA) is a precise cycle for distinguishing, announcing, proposin...
Q: The sovereign debt crisis in the euro zone led to depreciation of the dollar against the euro and po...
A: The sovereign debt crisis in the euro zone was the reason because the European countries were unable...
Q: You have developed the following simple product structure of items needed for your gift bag for a ru...
A: Given- Product structure tree-
Q: below? Scenario: A large, high volume warehouse-style discount grocery & retail operation
A: The processing capacity is always equal to the capacity of the bottleneck. It is good, to calculate ...
Q: Jobs arrive at Loaf Machine Shop. Assume the arrival rate is five jobs per hour. Service times (in m...
A: Given: For design A:mean service time = 6S.D = 3For design Bmean service time = 6.25S.D = 0.6
Q: What effect will decreasing the variability of the service rate have on the performance of the queui...
A: Service rate is the rate at which the customers are being served by the workers in the organisationa...
Q: As part of their application for a loan to buy Lakeside Farm, a property they hope to develop as a b...
A: Breakeven is that point where revenue is equal to cost
Q: MRP is more than an inventory system; what additionalcapabilities does MRP possess?
A: Material requirement planning is the production system of planning, inventory control and scheduling...
Q: obs arrive at Loaf Machine Shop. Assume the arrival rate is five jobs per hour. Service times (in mi...
A: Given:For design A:Mean service time= 6S.d=3For design B:Mean service time= 6.25S.d=0.6
Q: Location decisions represent a key part of the strategic planning process of virtually every organiz...
A: 1. Locations decisions pertain to the choice of appropriate sites form locating various the manufact...
Q: A project manager may need two skill sets – those of a manager and those of a leader. Explain this s...
A: Project management can be stated as the approach of leading the job or work of a group or team to ob...
Q: How are globally outsourced IT projects reliant on technology for virtual project management?
A: Historically, effective project management teams have been comprised of individuals who have previou...
Q: An organization may adopt four generic internationalisation strategies towards its global operations...
A: A multinational corporation is undoubtedly one that does business in more than one country (MNC). Th...
Q: 10. A female worker performs physical labor with an energy expenditure rate of 6.5 kcal/min for 25 m...
A: Twrk = 25 Min ERwrk = 6.5 Kcal/min ERrst = 2.0
Q: Your team has been assigned to complete 10 client projects over the next two months. These projects ...
A: Find the Given details below: Given Details: Project # Processing Time (days) Due date 1 6 17...
Q: ’s code of ethics to guide their decision making, what good are the codes?
A: An organization's code of ethics serves as a set of standards for employees, outlining acceptable co...
Q: How important does credibility mean for a project manager?
A: Credibility is created through a group of little points accomplished in the project. In project mana...
Q: 3. What is project management? Briefly describe the project management framework, providing examples...
A: NOTE - Because you asked numerous questions, we'll answer the first one for you. If you want a spec...
Q: Using MAD as a criterion, which technique has the better performance record?
A: MAD or Mean Absolute Deviation indicating the average value of the absolute errors. An efficient for...
Q: P(X)U.T0.24/0.304 U.155 0.194 Expected value = A previous analysis of historical records found that ...
A: A Small Introduction about Product Management The fundamental target of product management is the...
Q: There is no doubt that the Chinese government engages in restriction, remains authoritarian, and is ...
A: It is given that runaway is a manufacturer of shoes and sportswear and is considered socially respon...
Q: BETTER PRODUCTS COMPANY has decided to start manufacturing four new products in three plants that cu...
A: Total number of supply constraints : 3Total number of demand constraints : 4Problem Table is D...
Q: ter at a large regional hospital provides training sessions in CPR to all employees. Assume that the...
A: Following will be the definitions : Efficiency = (Actual output ÷ Effective capacity) × 100 Utilizat...
Q: A. Explain the manner in which pull systems can help an organization to achieve lean production. b...
A: A pull system is based on a lean manufacturing technique used to decrease waste in the manufacturing...
Q: Question 15 Gulong Inc are manufacturers of brakes sets for sedan and off-road SUVS vehicles. 500 ho...
A: Linear programming is an optimization technique, where the decision-maker uses the limited resources...
Q: Which of the following is not an operating characteristic used to measure the performance of a Waiti...
A: Waiting line Comprises the buyer population basis as well as the procedure or service system
Q: Use this data to build a Pareto chart to help identify the "vital few" problems. Next, build fishbon...
A: A Pareto chart is a bar graph arranged from longest to shortest bars combined with a frequency curve...
Q: E-procurement is changing the B2B transactions by automating the purchasing process helping to deliv...
A: eProcurement was initiated in the 1980s when electronic data interchange (EDI) was designed. EDI per...
Q: Which of the following are the technological attributes that contribute to project complexity? N...
A: Project complexity is the characteristic of a project which makes it challenging to comprehend, anti...
Q: a) Given the product structure and master production scheduleshown in Figure 14.12, develop a gross ...
A: A Small Introduction about Production Management Production the executives is a course of arrangi...
Q: ••$11.8 Over the past 12 months, Super Toy Mart has expe- rienced a demand variance of 10,000 units ...
A: A Small Introduction About Forecast Forecasting is a strategy that involves recorded information...
Q: An organization’s tier 1 suppliers constitute the _____ side network of the organization a. Upstream...
A:
Q: Can you provide an example of the things that differentiate an employee from an independent contrac...
A: The employees are paid wages constantly, get employee benefits, get their taxes deducted from the wa...
Q: Problem 225-17 (Algo) The M-N plant manufactures two different products: M and N. Selling prices and...
A: A Small Introduction of Supply Chain Management Supply Chain Management incorporates, arranges, p...
Q: Wood Log Company has forecasted the demand for wooden log for next month. The company has listed the...
A: The total flow times for all flow units that depart the process yield the average flow time. The flo...
Q: Differentiate operations in a surgical theatre from operations of a quick service restaurant.
A: A Small Introduction about Operation Management Operations management (OM) is the organization of...
Q: From Operations and Supply Chain Management 10th edition by ROBERTA S. RUSSELL BERNARD W. TAYLOR I...
A: A Small Introduction about Supply Chain Management Supply chain management (SCM) is the discipline ...
Q: Cutey Barber Salon Cutey Barber Salon is a trendy barber salon that is located in a densely popula...
A:
Q: The Laurenster Corporation is getting into the construction business. A list of activities and their...
A: ES = maximum (EF of all immediate predecessor) EF = ES + duration Minimum project duration = largest...
Q: ctual demand was 210 lakhs of saops , now using the smoothing constant choosen by the management of ...
A:
Q: What exactly is a JIT compiler
A: Just-in-time, or JIT, inventory management is a way of receiving items from suppliers just when they...
Q: 100% Inspection means every part is inspected in other words all parts or characteristics of a parti...
A: Definitions: Sampling: - Sampling is a process of checking each item or product from the lot or batc...
Q: Distributors for a furniture manufacturer are complaining that the billing for goods they order is f...
A: Database management is described as a task that is associated with the protection of organizational ...
Q: The maintenance department in Ranchi Hospital uses 816 cases of liquid cleanser annually. Ordering c...
A: Many firms instead of employing a reorder quantity formula when restocking items make orders dependi...
Q: Dwayne Cole, owner of Florida firm that manufactures display cabinets, develops an 8-month aggregate...
A: Find the Given details below: Month Jan Feb Mar Apr May June Jul Aug Total Demand (Unit) 255 29...
Show the steps on excel to plot the graph and insert the equation on the graph

Step by step
Solved in 2 steps with 3 images

- The Baker Company wants to develop a budget to predict how overhead costs vary with activity levels. Management is trying to decide whether direct labor hours (DLH) or units produced is the better measure of activity for the firm. Monthly data for the preceding 24 months appear in the file P13_40.xlsx. Use regression analysis to determine which measure, DLH or Units (or both), should be used for the budget. How would the regression equation be used to obtain the budget for the firms overhead costs?Suppose that a regional express delivery service company wants to estimate the cost of shipping a package (Y) as a function of cargo type, where cargo type includes the following possibilities: fragile, semifragile, and durable. Costs for 15 randomly chosen packages of approximately the same weight and same distance shipped, but of different cargo types, are provided in the file P13_16.xlsx. a. Estimate a regression equation using the given sample data, and interpret the estimated regression coefficients. b. According to the estimated regression equation, which cargo type is the most costly to ship? Which cargo type is the least costly to ship? c. How well does the estimated equation fit the given sample data? How might the fit be improved? d. Given the estimated regression equation, predict the cost of shipping a package with semifragile cargo.The owner of a restaurant in Bloomington, Indiana, has recorded sales data for the past 19 years. He has also recorded data on potentially relevant variables. The data are listed in the file P13_17.xlsx. a. Estimate a simple regression equation involving annual sales (the dependent variable) and the size of the population residing within 10 miles of the restaurant (the explanatory variable). Interpret R-square for this regression. b. Add another explanatory variableannual advertising expendituresto the regression equation in part a. Estimate and interpret this expanded equation. How does the R-square value for this multiple regression equation compare to that of the simple regression equation estimated in part a? Explain any difference between the two R-square values. How can you use the adjusted R-squares for a comparison of the two equations? c. Add one more explanatory variable to the multiple regression equation estimated in part b. In particular, estimate and interpret the coefficients of a multiple regression equation that includes the previous years advertising expenditure. How does the inclusion of this third explanatory variable affect the R-square, compared to the corresponding values for the equation of part b? Explain any changes in this value. What does the adjusted R-square for the new equation tell you?
- The file P13_22.xlsx contains total monthly U.S. retail sales data. While holding out the final six months of observations for validation purposes, use the method of moving averages with a carefully chosen span to forecast U.S. retail sales in the next year. Comment on the performance of your model. What makes this time series more challenging to forecast?The management of a technology company is trying to determine the variable that best explains the variation of employee salaries using a sample of 52 full-time employees; see the file P13_08.xlsx. Estimate simple linear regression equations to identify which of the following has the strongest linear relationship with annual salary: the employees gender, age, number of years of relevant work experience prior to employment at the company, number of years of employment at the company, or number of years of post secondary education. Provide support for your conclusion.The file P13_02.xlsx contains five years of monthly data on sales (number of units sold) for a particular company. The company suspects that except for random noise, its sales are growing by a constant percentage each month and will continue to do so for at least the near future. a. Explain briefly whether the plot of the series visually supports the companys suspicion. b. By what percentage are sales increasing each month? c. What is the MAPE for the forecast model in part b? In words, what does it measure? Considering its magnitude, does the model seem to be doing a good job? d. In words, how does the model make forecasts for future months? Specifically, given the forecast value for the last month in the data set, what simple arithmetic could you use to obtain forecasts for the next few months?
- The file P13_42.xlsx contains monthly data on consumer revolving credit (in millions of dollars) through credit unions. a. Use these data to forecast consumer revolving credit through credit unions for the next 12 months. Do it in two ways. First, fit an exponential trend to the series. Second, use Holts method with optimized smoothing constants. b. Which of these two methods appears to provide the best forecasts? Answer by comparing their MAPE values.A small computer chip manufacturer wants to forecast monthly ozperating costs as a function of the number of units produced during a month. The company has collected the 16 months of data in the file P13_34.xlsx. a. Determine an equation that can be used to predict monthly production costs from units produced. Are there any outliers? b. How could the regression line obtained in part a be used to determine whether the company was efficient or inefficient during any particular month?The file P13_29.xlsx contains monthly time series data for total U.S. retail sales of building materials (which includes retail sales of building materials, hardware and garden supply stores, and mobile home dealers). a. Is seasonality present in these data? If so, characterize the seasonality pattern. b. Use Winters method to forecast this series with smoothing constants = = 0.1 and = 0.3. Does the forecast series seem to track the seasonal pattern well? What are your forecasts for the next 12 months?
- Do the sales prices of houses in a given community vary systematically with their sizes (as measured in square feet)? Answer this question by estimating a simple regression equation where the sales price of the house is the dependent variable, and the size of the house is the explanatory variable. Use the sample data given in P13_06.xlsx. Interpret your estimated equation, the associated R-square value, and the associated standard error of estimate.The file P13_26.xlsx contains the monthly number of airline tickets sold by the CareFree Travel Agency. a. Create a time series chart of the data. Based on what you see, which of the exponential smoothing models do you think will provide the best forecasting model? Why? b. Use simple exponential smoothing to forecast these data, using a smoothing constant of 0.1. c. Repeat part b, but search for the smoothing constant that makes RMSE as small as possible. Does it make much of an improvement over the model in part b?Under what conditions might a firm use multiple forecasting methods?

