Department of Research and Development of Unilever Sdn Bhd has condi study to improve the quality of production line by measured the weight (in o of 50 bars of soap. The results are as shown in Table 2(b). (b) Table 2(b) Weight of soap 11 14 15 12 14 12 14 15 12 13 13 13 15 13 15 13 15 14 15 16 15 15 16 16 16 16 16 16 16 18 17 18 17 18 17 18 17 18 17 18 17 18 17 19 17 (i) Calculate the mean, standard deviation and variance. (ii) By using 6 of class interval, construct a histogram for this data.
Department of Research and Development of Unilever Sdn Bhd has condi study to improve the quality of production line by measured the weight (in o of 50 bars of soap. The results are as shown in Table 2(b). (b) Table 2(b) Weight of soap 11 14 15 12 14 12 14 15 12 13 13 13 15 13 15 13 15 14 15 16 15 15 16 16 16 16 16 16 16 18 17 18 17 18 17 18 17 18 17 18 17 18 17 19 17 (i) Calculate the mean, standard deviation and variance. (ii) By using 6 of class interval, construct a histogram for this data.

Glencoe Algebra 1, Student Edition, 9780079039897, 0079039898, 2018
18th Edition
ISBN:9780079039897
Author:Carter
Publisher:Carter
Chapter10: Statistics
Section10.4: Distributions Of Data
Problem 7PPS

Related questions
Question
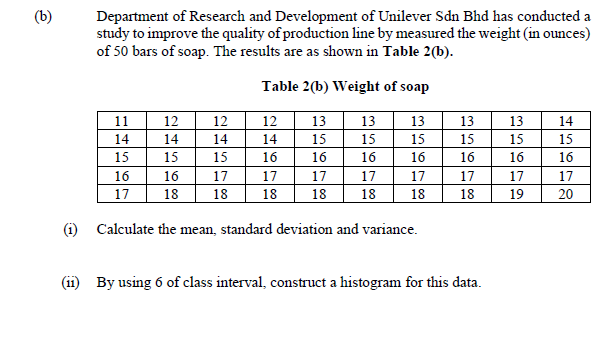
Transcribed Image Text:Department of Research and Development of Unilever Sdn Bhd has conducted a
study to improve the quality of production line by measured the weight (in ounces)
of 50 bars of soap. The results are as shown in Table 2(b).
Table 2(b) Weight of soap
11
12
12
12
13
13
13
13
13
14
14
14
14
14
15
15
15
15
15
15
15
15
15
16
16
16
16
16
16
16
16
16
17
17
17
17
17
17
17
17
17
18
18
18
18
18
18
18
19
20
(1) Calculate the mean, standard deviation and variance.
(ii) By using 6 of class interval, construct a histogram for this data.
Expert Solution
This question has been solved!
Explore an expertly crafted, step-by-step solution for a thorough understanding of key concepts.

Step by step
Solved in 2 steps with 1 images

Recommended textbooks for you
Glencoe Algebra 1, Student Edition, 9780079039897…
Algebra
ISBN:
9780079039897
Author:
Carter
Publisher:
McGraw Hill
Glencoe Algebra 1, Student Edition, 9780079039897…
Algebra
ISBN:
9780079039897
Author:
Carter
Publisher:
McGraw Hill