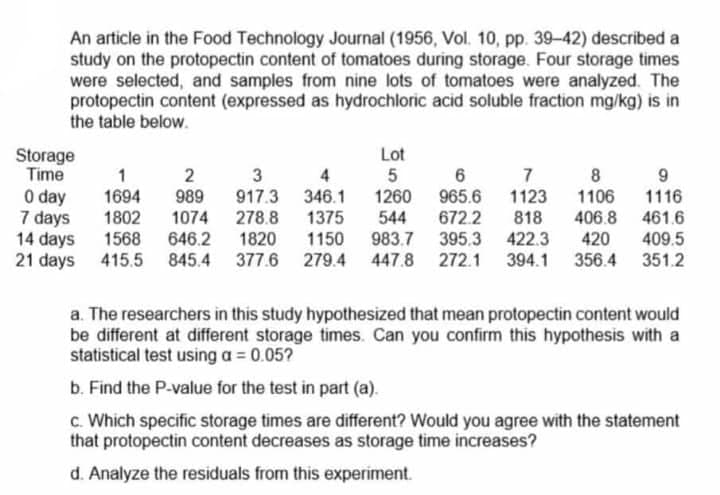
An article in the Food Technology Journal (1956, Vol. 10, pp. 39-42) described a study on the protopectin content of tomatoes during storage. Four storage times were selected, and samples from nine lots of tomatoes were analyzed. The protopectin content (expressed as hydrochloric acid soluble fraction mg/kg) is in the table below. Lot Storage Time 1 2 3 4 6 7 8 9 5 346.1 1260 0 day 1694 989 965.6 1116 7 days 461.6 917.3 1123 1106 1802 1074 278.8 1375 544 672.2 818 406.8 1568 646.2 1820 1150 983.7 395.3 422.3 415.5 845.4 377.6 279.4 447.8 272.1 394.1 356.4 351.2 14 days 420 409.5 21 days a. The researchers in this study hypothesized that mean protopectin content would be different at different storage times. Can you confirm this hypothesis with a statistical test using a = 0.05? b. Find the P-value for the test in part (a). c. Which specific storage times are different? Would you agree with the statement that protopectin content decreases as storage time increases? d. Analyze the residuals from this experiment.
An article in the Food Technology Journal (1956, Vol. 10, pp. 39-42) described a study on the protopectin content of tomatoes during storage. Four storage times were selected, and samples from nine lots of tomatoes were analyzed. The protopectin content (expressed as hydrochloric acid soluble fraction mg/kg) is in the table below. Lot Storage Time 1 2 3 4 6 7 8 9 5 346.1 1260 0 day 1694 989 965.6 1116 7 days 461.6 917.3 1123 1106 1802 1074 278.8 1375 544 672.2 818 406.8 1568 646.2 1820 1150 983.7 395.3 422.3 415.5 845.4 377.6 279.4 447.8 272.1 394.1 356.4 351.2 14 days 420 409.5 21 days a. The researchers in this study hypothesized that mean protopectin content would be different at different storage times. Can you confirm this hypothesis with a statistical test using a = 0.05? b. Find the P-value for the test in part (a). c. Which specific storage times are different? Would you agree with the statement that protopectin content decreases as storage time increases? d. Analyze the residuals from this experiment.

Glencoe Algebra 1, Student Edition, 9780079039897, 0079039898, 2018
18th Edition
ISBN:9780079039897
Author:Carter
Publisher:Carter
Chapter10: Statistics
Section10.1: Measures Of Center
Problem 9PPS

Related questions
Question
pls help! rate will be given! Write the solutions legibly!
DATA ANALYSIS
Transcribed Image Text:An article in the Food Technology Journal (1956, Vol. 10, pp. 39-42) described a
study on the protopectin content of tomatoes during storage. Four storage times
were selected, and samples from nine lots of tomatoes were analyzed. The
protopectin content (expressed as hydrochloric acid soluble fraction mg/kg) is in
the table below.
Storage
Lot
Time
1
2
4
5
6
7
8
9
3
917.3 346.1
0 day
1694 989
1260
1116
965.6 1123 1106
672.2 818 406.8
7 days
1802
1074
278.8
1375 544
461.6
14 days
1568
646.2
1820 1150
983.7 395.3 422.3 420
409.5
21 days
415.5 845.4 377.6
279.4 447.8 272.1 394.1 356.4
351.2
a. The researchers in this study hypothesized that mean protopectin content would
be different at different storage times. Can you confirm this hypothesis with a
statistical test using a = 0.05?
b. Find the P-value for the test in part (a).
c. Which specific storage times are different? Would you agree with the statement
that protopectin content decreases as storage time increases?
d. Analyze the residuals from this experiment.
Expert Solution
This question has been solved!
Explore an expertly crafted, step-by-step solution for a thorough understanding of key concepts.

This is a popular solution!

Trending now
This is a popular solution!

Step by step
Solved in 4 steps with 5 images

Follow-up Questions
Read through expert solutions to related follow-up questions below.
Follow-up Question
For part a), do we need to solve it with one-way anova or two-way anova?
Solution
Recommended textbooks for you
Glencoe Algebra 1, Student Edition, 9780079039897…
Algebra
ISBN:
9780079039897
Author:
Carter
Publisher:
McGraw Hill
Glencoe Algebra 1, Student Edition, 9780079039897…
Algebra
ISBN:
9780079039897
Author:
Carter
Publisher:
McGraw Hill