Dermnd 13.50 QUANTIY knya mplete the falloming table, given the informatan presented an the graph. tesult Value Equlitrium quantity after lan Wer-unt tax Price producers receive before ta the folloming tabie, indhcate which aras on the previos graph carrespand to each concept. Check al that apply. Concept Consumer splus after the tanmposed Producer surplus before the tax i imposed Tax revenue after the tan is imposed anpudd
Dermnd 13.50 QUANTIY knya mplete the falloming table, given the informatan presented an the graph. tesult Value Equlitrium quantity after lan Wer-unt tax Price producers receive before ta the folloming tabie, indhcate which aras on the previos graph carrespand to each concept. Check al that apply. Concept Consumer splus after the tanmposed Producer surplus before the tax i imposed Tax revenue after the tan is imposed anpudd

Microeconomics: Principles & Policy
14th Edition
ISBN:9781337794992
Author:William J. Baumol, Alan S. Blinder, John L. Solow
Publisher:William J. Baumol, Alan S. Blinder, John L. Solow
Chapter6: Demand And Elasticity
Section: Chapter Questions
Problem 3TY

Related questions
Question
The following graph represents the
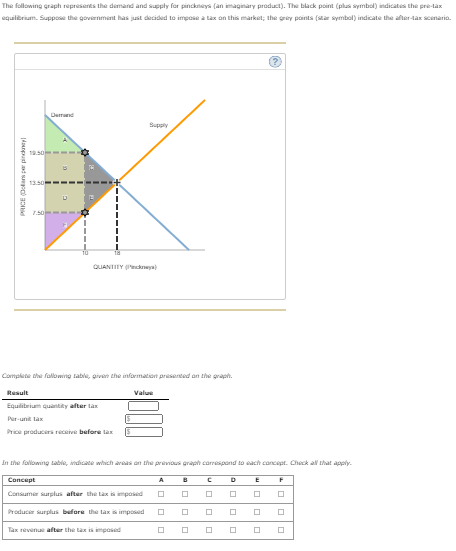
Transcribed Image Text:The following graph represents the demand and supply for pinckneys (an imaginary product). The black point (plusi symbol) indicates the pre-lax
equilibrium. Suppose the government has just decided to impose a tax on this market; the grey points (star symbol) indicate the after-tar scenaria.
Dermnd
Supply
1.50
13.50
1.50
18
QUANTITY (kneya)
Complete the falowing table, given the information presented an the graph.
Result
Value
Equilibrium quantity after lax
Per-unit lax
Price producers receive before lax
In the following lable, indicate which areas an the previdus graph carrespand to each concept. Check al that apply.
E
Concept
Consumer surplus after the tax mposed
A
Producer surplus before the lax is imposed
Tax revenue after the tax is mposed
|이 □| □| □
| 미미| 미
Aunpud ad oo od
Expert Solution
This question has been solved!
Explore an expertly crafted, step-by-step solution for a thorough understanding of key concepts.

This is a popular solution!

Trending now
This is a popular solution!

Step by step
Solved in 2 steps with 1 images

Recommended textbooks for you
Microeconomics: Principles & Policy
Economics
ISBN:
9781337794992
Author:
William J. Baumol, Alan S. Blinder, John L. Solow
Publisher:
Cengage Learning


Economics (MindTap Course List)
Economics
ISBN:
9781337617383
Author:
Roger A. Arnold
Publisher:
Cengage Learning
Microeconomics: Principles & Policy
Economics
ISBN:
9781337794992
Author:
William J. Baumol, Alan S. Blinder, John L. Solow
Publisher:
Cengage Learning
Economics (MindTap Course List)
Economics
ISBN:
9781337617383
Author:
Roger A. Arnold
Publisher:
Cengage Learning


Economics: Private and Public Choice (MindTap Cou…
Economics
ISBN:
9781305506725
Author:
James D. Gwartney, Richard L. Stroup, Russell S. Sobel, David A. Macpherson
Publisher:
Cengage Learning