

Q: It is true that inflation is a Select one: a. continuous fall in prices b. continuous increase in…
A: Definition inflation is the increase in economics overall price.
Q: During July 2020, Japan’s u was 2.6%; economists have estimated that Japan’s un is 2.5%. If Japan…
A: Unemployment below the natural rate implies an accelerating price level. This relationship is called…
Q: Assuming prices and output are somewhat flexible, an increase in consumer spending will cause…
A: The assumption that prices and output(y) are flexible allows for changes in the equilibrium level as…
Q: Assuming prices are sticky in the short run, a decrease in useful government spending will cause…
A: Decrease in G shifts the AD curve to the left, leading to a lower real GDP and a lower price level…
Q: Which policy measure may reduce demand-pull inflation but increase cost-push inflation? Pick a,b,c,…
A: Demand-pull inflation is the growing price pressure that comes with a supply shortage, which…
Q: Distinguish between anticipated, unanticipated, and imperfectly anticipated inflation regarding its…
A: Anticipated inflation is the predicted percentage increase in the level of prices in a given economy…
Q: The most common definition that monetary policymakers use for price stability is Question 15…
A: Inflation rate is the increase in average price level of goods and services produced in the economy.
Q: Discuss critically about demand-pull and cost-push inflation with the help of graphically and…
A: Inflation is defined as a prolonged rise in the overall price level, resulting in a loss of money's…
Q: True or False... There are an infinite number of combinations of real interest rates and inflation…
A: A nominal interest rate of zero is known as the zero lower bound that is the level of the interest…
Q: Distinguish between demand-pull inflation and cost-push inflation. Which of the two types is most…
A: Inflation refers to the increase in the general price level. The quantity demanded and quantity…
Q: Please provide examples, it is crucial. If inflation raises unexpectedly by 5% indicate for each…
A:
Q: To what extent do the advantages of inflation for an economy outweigh the disadvantages? You are…
A: Inflation: Inflation can be defined as continuous rise in price . That is if there is increment in…
Q: Which of the following statements are FALSE?Select all appropriate choices. When the inflation rate…
A: In an economy, inflation rate is considered as a macroeconomic variable as it influence the economy…
Q: Q 3. Which type of inflation is considered good for the economy and why? Explain you answer using…
A: Which type of inflation is considered good for the economy and why? Explain you answer using one…
Q: Suppose that government decides to support the firms for their investments in research and the…
A:
Q: n the last year there has been a significant increase in the inflation rate in Canada. Use the…
A: The LM curve shows the direct relationship between interest rate and quantity of money. It means the…
Q: In every election year, politicians sing their own praises of having stabilized prices through the…
A: Persistent rise in prices of goods and services leafs to inflation. When aggregate demand exceeds…
Q: aggregate demand and aggregate supply
A: The aggregate demand (AD) curve represents the total quantity of goods and services demanded in the…
Q: Assume that an increase in aggregate demand results in a positive bargaining gap which is constant…
A: Meaning of Inflation: The term inflation refers to the situation under which there is an excessive…
Q: Which type of inflation is considered good for the economy and why? Explain you answer using one…
A: Inflation is defined as the overall increase in the price level in the economy. The rate of…
Q: Assess the impact of money supply changes on inflation with diagram
A: In an economy, inflation is explained by when people have to pay a relative more price for a…
Q: According to the Fisher effect theory, the difference between the nominal and real interest rates in…
A: The nominal interest rate the rate you pay on an advance. The genuine loan cost is the nominal…
Q: What is meant by the substitution effect when measuring inflation and does the substitution effect…
A: Answer: Substitution effect: when the price of a good increases the consumers find a cheaper…
Q: Example of inflation with solution
A: Inflation is continuous rise in prices. For example, continues rise in the price of milk, and…
Q: Economists widely agree that the Consumer Price Index understates the true U.S. inflation rate.…
A: Consumer price index does not include imported goods.
Q: Suppose that government decides to support the firms for their investments in research and the…
A: Increase in productivity decreases production cost, so aggregate supply will rise, shifting SRAS…
Q: Identify and briefly describe some statistical index to measure the effects of inflation
A: Inflation alludes to changes over the long haul in the general degree of prices of labor and…
Q: Which of these is not a factor that causes demand-pull inflation? a. Private consumption b.…
A: Demand is the sum of the total quantity of commodities that the consumers are willing to purchase at…
Q: Define inflation. Explain why inflations needs to be managed
A: The economics as a study is a vast area of study which is based upon the basic idea of scarcity of…
Q: What might be an unintended effect of an inflation rate ceiling? Group of answer choices The real…
A: As per the Fisher equation, Real interest rate = Nominal interest rate - Inflation rate
Q: Nobel prize-winning economist Milton Friedman once had the following statement: "In- flation is…
A: Inflation refers to the persistent rise in the general price level. Inflation is worrisome for the…
Q: Explain TWO costs of inflation from an economist’s perspective.
A: Two costs of inflation are : 1. Price system is distorted by Inflation. Inflation is the increase…
Q: Inflation targets are usually specified as a. a range for the inflation rate. b. a specific…
A: Inflation is referred to as general rise in the prices of goods and services which declines the…
Q: Whenever the inflation rate is released by the BLS, they publish both the headline rate and the core…
A: By Headline Inflation we mean the total inflation for the period comprising a basket of commodities.…
Q: Describe an example of demand-pull inflation. And describe an example of cost-push inflation.
A: Inflation is a situation in which general price level rise. As a result of inflation, there is…
Q: Suppose the Fed wants to set the real interest rate 1 percentage point lower than the inflation…
A: Schedule for inflation and real interest rates based on Fed targets -
Q: Suppose that the inflation rate remains constant while output increases and the unemployment rate…
A: The aggregate supply and aggregate demand model shows the relationship between real GDP and price…
Q: The cost of inflation reduction is a large, permanent increase in unemployment. true or false
A: The Phillips curve basically depicts the relationship between inflation and unemployment, and the…
Q: In March of 2020, the Bank of Canada dropped the policy interest rate three times. Were these action…
A: Inflation: - it is the phenomenon of an increase in the prices of goods and services in an economy.
Q: which of the following is true Select one: a. When the actual rate of unemployment is low than…
A: Answer: option b (natural rate of unemployment is the rate of unemployment required to keep the…
Q: Explain walking inflation
A: Definition of inflation : The rate at which prices increase over a specific time period is known as…
Q: Explain with example the procedure of handling the multiple inflation rates?
A: Inflation refers to the rise in the prices of goods and services over a period of time. There are…
Q: Expectations of inflation are ____________ effective than/as actual inflation in ____________…
A: Inflation is the general increase in the overall prices in the economy.
Q: Please draw the Philips curve with a positive relationship between aggregate output and inflation…
A: Phillips curve is a type of curve which shows opposite relationship between inflation rate and…
- Describe the inflation rate trend in the inflation rate graph provided.
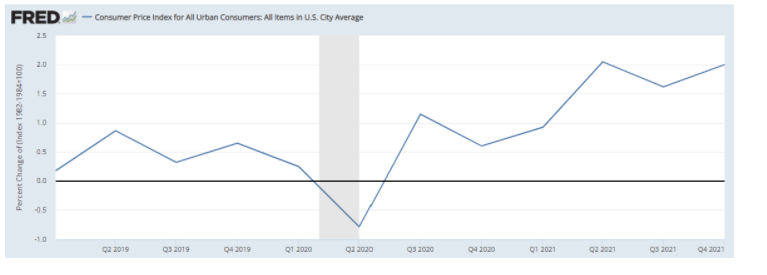
Inflation refers to an increase in the prices of goods and services in an economy over a period of time. This implies a rise in the general price level in an economy. There are three trends of inflation in an economy:
- Increasing: In this, rate of inflation increases over a period of time
- Declining: In this, rate of inflation decreases over a period of time
- Stable: In this, rate of inflation remains constant or little change over a period of time.

Trending now
This is a popular solution!

Step by step
Solved in 4 steps with 3 images


- Calculate a new consumer price index for the data in the following exhibit. Assume that current-year prices of Twinkies, fuel oil, and internet are $0.95/package, $1.25/gallon, and $15.00/month, respectively. Calculate the current year’s cost of the market basket and the value of the current year’s price index. What is this year’s percentage change in the price level compared to the base year? Product (1) Quantity in Market Basket (2) Prices in Base Year Twinkies 365 packages $ 0.89/package Fuel oil 500 gallons 1.00/gallon Internet 12 months 30.00/monthYear 2000 2010 Price of an automobile $40, 000 $50, 000 Price of a loaf bread $20 $30 Number of ao=utomobiles produced 100 cars 120 cars Number of loaves of bread produced 600,000 loaves 500, 000 loaves Using the table above calculate: how much have prices risen between the year 2000 and 2010 and comapre the answer given by Laspeyres and Passche price indicesQuestion 6 If a market basket was defined in 2014 and it cost $10,000 to purchase the items in that basket in 2014, while it cost $11,000 to purchase those identical goods in 2015, then the price index for 2015 is a (10000/11000)*100=90.9. b) 100. c) (11000/10000)*100=110. d) unknown given this data.
- Suppose seafood price and quantity data for the years 2000 and 2009 follow. Use 2000 as the base period. Seafood 2000Qty. (lb) 2000Price ($/lb) 2009Price ($/lb) Halibut 75,290 2.01 2.33 Lobster 83,080 3.62 3.09 Tuna 50,779 1.87 1.97 (a) Compute a price relative for each type of seafood. (Round your answers to one decimal place.) Seafood Price Relative Halibut ? Lobster ? Tuna ? (b) Compute a weighted aggregate price index for the seafood catch. (Round your answer to one decimal place.) I2009 = ?? Comment on the change in seafood prices over the nine-year period. (Enter your percentage as a positive value. Round your answer to one decimal place.) Seafood prices have Up/down by ? % over the 9-year period according to the index.1.Using 2016 as the base year, calculate the Laspeyre’s Quantity Index for 2021.A 138.60B 207.47C 72.15D 149.862.In general, consumers are price-takers; thus, they are expected to react to price changes by substituting ice-creamflavours that have become relatively cheaper for those that have become relatively more expensive. This phenomenon isconsistent with the substitution effect. Substitution tends to cause a negative correlation between the price and quantityrelatives.With regard to the observation above, and the indices calculated above, which of the following is false?A The transaction data on the ice-cream sales is not indicative of substitution effect.B The Paasche’s indices are relatively greater than the Laspeyre’s indices.C The price and quantity relatives of the ice-cream data are positively correlated.D The price and quantity relatives of the ice-cream data are negatively correlated.Suppose the index of prices received by date farmers in Oman for 2008was 1.04 and the base year of index was 1999. Then, OPTIONS: (i) Relative to 1999, farm prices were 104% higher in 2008. (ii) Relative to 2008, farm prices were 4% higher in 1999. (iii) Relative to 2008, farm prices were 104% higher in 1999. (iv) Relative to 1999, farm prices were 4% higher in 2008.
- 1. In April 2020, at the trough of the Covid-19 recession – which lasted a whopping two months – the Bureau of Labor Statistics announced that of all adult Americans, 133,320,000 were employed, 23,038,000 were unemployed, and 103,538,000 were not in the labor force. Use this information to calculate: a. the adult population: b. the labor force: c. the labor-force participation rate (enter this as a three-decimal number, e.g., 0.123, not as a percentage): d. the unemployment rate (enter this as a three-decimal number, e.g., 0.123, not as a percentage):Government survey-takers noted the following prices each year for the listed items. Items 2016 2017 2018 Pizza $10 $20 $20 Cell Phone Service $90 $180 $180 Crude Oil (barrel) $90 $180 $90 Calculate the percentage increase in PPI from the base year, 2016 to 2017.To convert the original earnings of Nicklaus, Trevino, and Stadler, use the formula for converting dollar figures from an earlier era into year 2017 U.S. dollars. Using those figures, fill in the following table, making sure to round your responses to the nearest U.S. dollar. Year Golfer Nominal Winnings U.S. CPI Winnings in 2017 Dollars (Dollars) (1983 = 100) 1965 Jack Nicklaus 140,752 31.5 1970 Lee Trevino 157,037 38.8 1982 Craig Stadler 446,462 96.5 2017 Justin Thomas 9,921,560 245.1 9,921,560 True or False: According to the previous table, the golfer with the highest PGA winnings in nominal dollars is the same as the golfer with the highest PGA winnings after adjusting for inflation.
- Monthly Consumer Price Index from January 2015 to December 2020 (Source: STATIN) Month 2015 2016 2017 2018 2019 2020 January 85.4 88.6 90.9 95.2 97.4 102.5 February 84.8 87.9 91.1 95.1 97.4 103.2 March 85.3 87.8 91.4 95.0 98.2 102.9 April 85.4 87.5 91.7 94.6 98.3 103.7 May 85.9 87.7 91.8 94.6 99.1 103.8 June 86.3 88.5 92.4 95.0 99.0 105.2 July 87.0 88.9 92.9 95.9 100.0 105.7 August 87.7 89.3 93.2 96.8 100.8 105.9 September 88.1 89.7 93.8 97.9 101.2 106.1 October 88.4 89.9 94.2 98.6 101.8 106.9 November 88.8 90.3 94.7 98.6 103.2 107.6 December 89.0 90.5 95.2 97.6 103.6 109.0 From the Table above: In December 2018, Mr. Logan Hepburn began receiving a salary of $100,000 per month.Up to December 2020, his salary has remained unchanged. What is his ‘‘real wage’’ in December…Please no written by hand and no emage Fruit prices and the amounts consumed for 2010 and 2018 are shown. Use 2010 as the base. 2010 2018 Fruit Price Quantity Price Quantity Bananas (pound) $ 0.27 100 $ 0.30 110 Grapefruit (each) 0.26 50 0.63 53 Apples (pound) 0.34 85 0.49 85 Strawberries (basket) 1.01 8 2.47 11 Oranges (bag) 0.91 6 1.23 9 a. Determine the simple price indexes. (Round your answers to 2 decimal places.)Bananas,Grapefruit,Apples,Strawberries,Oranges b. Determine the simple aggregate price index for the two years. (Round your answer to 2 decimal places.)c. Determine the Laspeyres price index. (Round your answer to 2 decimal places.)d. Determine the Paasche price index. (Round your answer to 2 decimal places.)e. Determine Fisher's ideal index. (Round your answer to 2 decimal places.)Year Price of Pizza Price of Beer 2010 $10 $15 2011 $12 $16 2012 $14 $17 Table 2. Let 2010 be the base yearUse the following market basket: 100 pizzas 300 cases of beerRefer to Table 2. What is the price index in 2012? Question 22 options: a) 125 b) 118 c) 105 d) 132

