Describe what the graph reveals about the association between these two variables for the 1200 College students in the sample
Describe what the graph reveals about the association between these two variables for the 1200 College students in the sample

Glencoe Algebra 1, Student Edition, 9780079039897, 0079039898, 2018
18th Edition
ISBN:9780079039897
Author:Carter
Publisher:Carter
Chapter10: Statistics
Section10.4: Distributions Of Data
Problem 19PFA

Related questions

Concept explainers
Contingency Table
A contingency table can be defined as the visual representation of the relationship between two or more categorical variables that can be evaluated and registered. It is a categorical version of the scatterplot, which is used to investigate the linear relationship between two variables. A contingency table is indeed a type of frequency distribution table that displays two variables at the same time.
Binomial Distribution
Binomial is an algebraic expression of the sum or the difference of two terms. Before knowing about binomial distribution, we must know about the binomial theorem.
Topic Video
Question
Describe what the graph reveals about the association between these two variables for the 1200 College students in the sample.
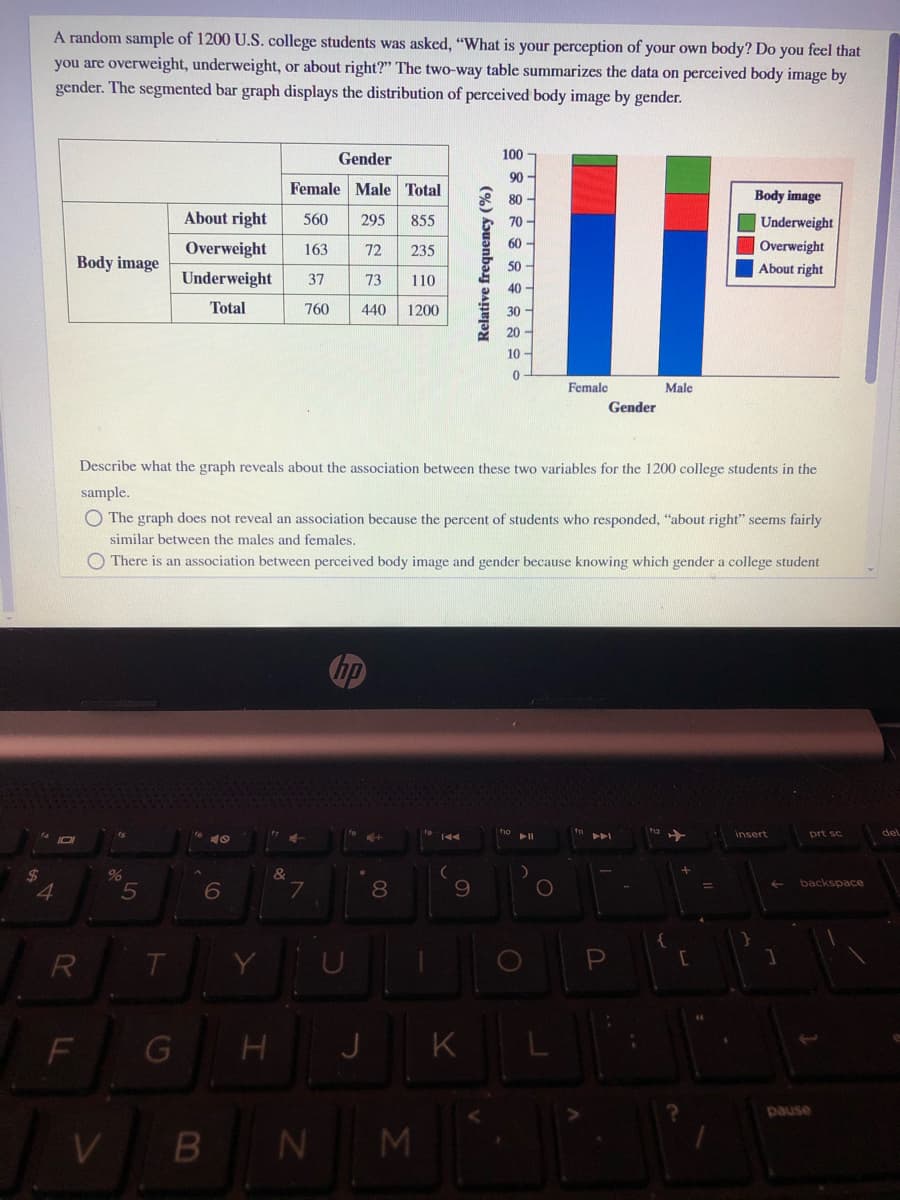
Transcribed Image Text:A random sample of 1200 U.S. college students was asked, "What is your perception of your own body? Do you feel that
you are overweight, underweight, or about right?" The two-way table summarizes the data on perceived body image by
gender. The segmented bar graph displays the distribution of perceived body image by gender.
Gender
100
90 -
Female Male Total
80 -
Body image
About right
560
295
855
Underweight
70-
Overweight
163
72
235
60 -
Overweight
Body image
50
About right
Underweight
37
73
110
40 -
Total
760
440
1200
30 -
20 -
10 -
Female
Male
Gender
Describe what the graph reveals about the association between these two variables for the 1200 college students in the
sample.
O The graph does not reveal an association because the percent of students who responded, "about right" seems fairly
similar between the males and females.
O There is an association between perceived body image and gender because knowing which gender a college student
insert
prt sc
del
%24
4
5.
backspace
8
R
H J K
pause
N M
Relative frequency (%)
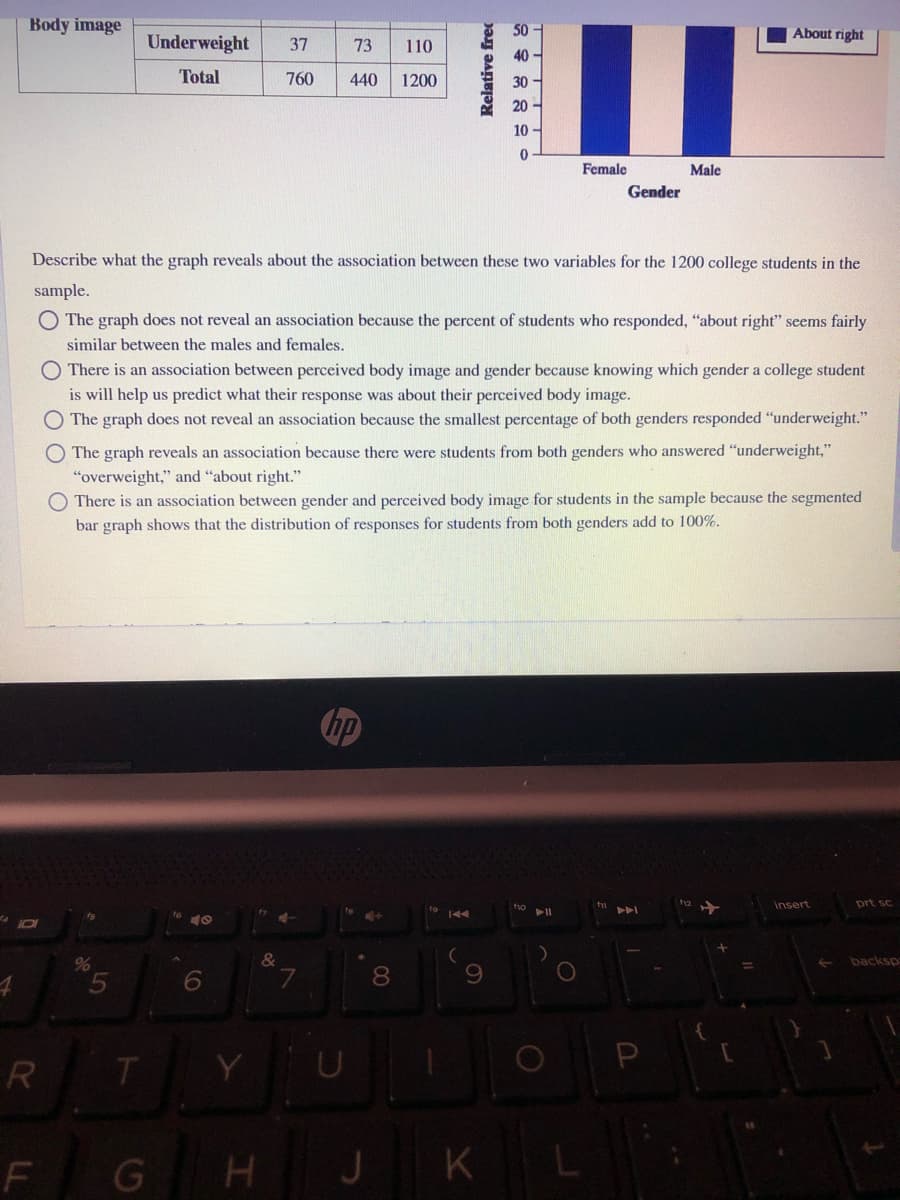
Transcribed Image Text:Body image
50
About right
Underweight
37
73
110
40
Total
760
440
1200
30
20
10
Female
Male
Gender
Describe what the graph reveals about the association between these two variables for the 1200 college students in the
sample.
O The graph does not reveal an association because the percent of students who responded, "about right" seems fairly
similar between the males and females.
There is an association between perceived body image and gender because knowing which gender a college student
is will help us predict what their response was about their perceived body image.
The graph does not reveal an association because the smallest percentage of both genders responded "underweight."
O The graph reveals an association because there were students from both genders who answered "underweight,"
"overweight," and "about right."
There is an association between gender and perceived body image for students in the sample because the segmented
bar graph shows that the distribution of responses for students from both genders add to 100%.
hp
insert
prt sc
fio
&
backsp
8
R
T.
G H
JK L
Relative free
Expert Solution
This question has been solved!
Explore an expertly crafted, step-by-step solution for a thorough understanding of key concepts.

This is a popular solution!

Trending now
This is a popular solution!

Step by step
Solved in 2 steps with 1 images

Knowledge Booster


Learn more about
Need a deep-dive on the concept behind this application? Look no further. Learn more about this topic, statistics and related others by exploring similar questions and additional content below.Recommended textbooks for you
Glencoe Algebra 1, Student Edition, 9780079039897…
Algebra
ISBN:
9780079039897
Author:
Carter
Publisher:
McGraw Hill

Holt Mcdougal Larson Pre-algebra: Student Edition…
Algebra
ISBN:
9780547587776
Author:
HOLT MCDOUGAL
Publisher:
HOLT MCDOUGAL
Glencoe Algebra 1, Student Edition, 9780079039897…
Algebra
ISBN:
9780079039897
Author:
Carter
Publisher:
McGraw Hill
Holt Mcdougal Larson Pre-algebra: Student Edition…
Algebra
ISBN:
9780547587776
Author:
HOLT MCDOUGAL
Publisher:
HOLT MCDOUGAL