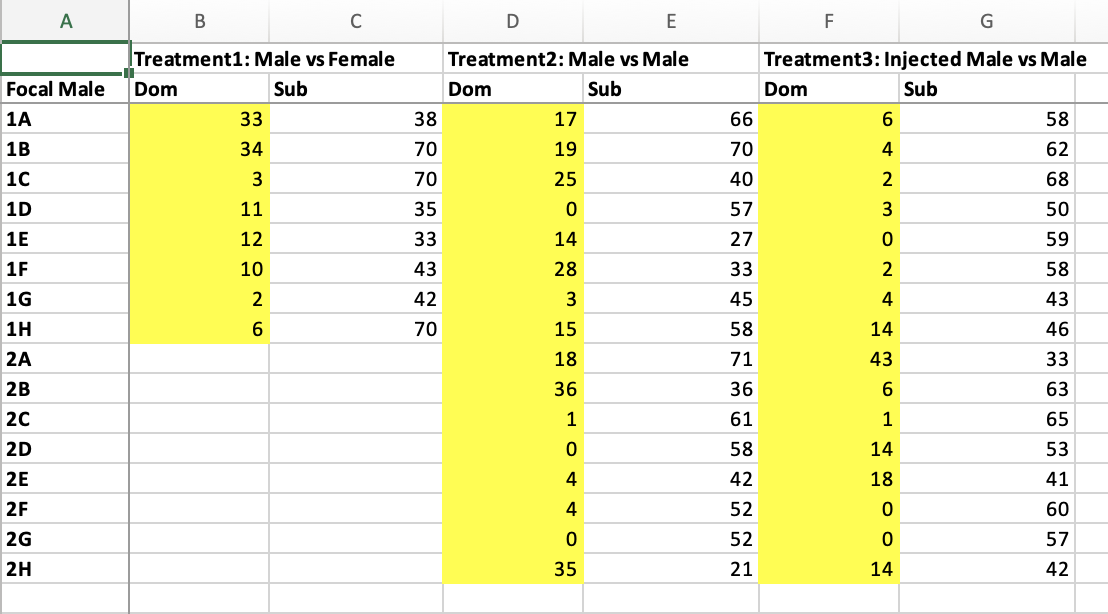
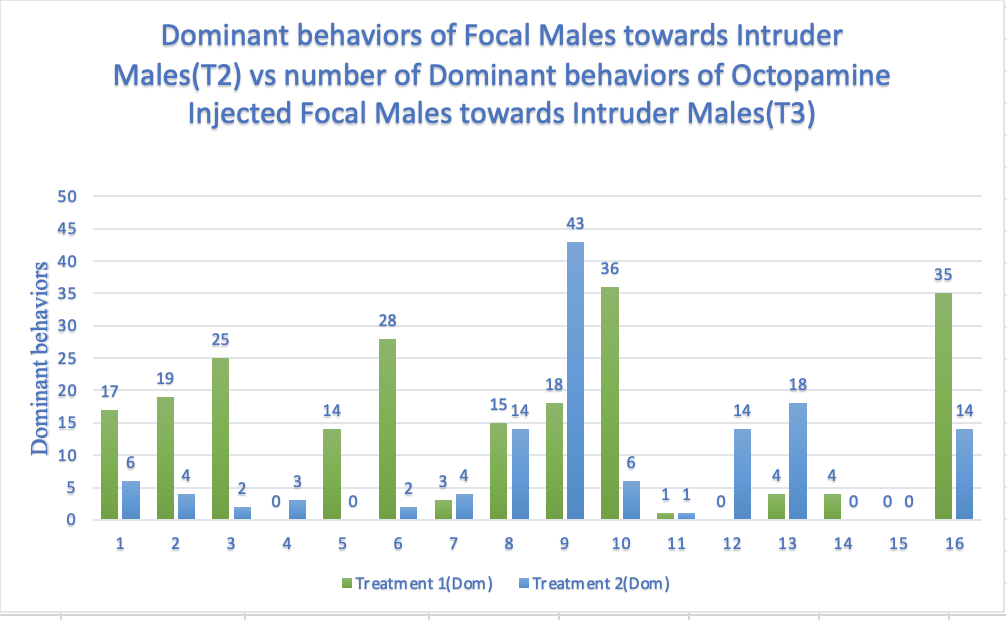
Give a brief analysis on the graph given in the picture by using the data (Dominant behaviors of reisdent male with or without injecting


Q: Find means of X and Y and correlation coefficient.
A: Here given two equations of lines
Q: Use the table below in answering item numbers 9 - 10. H P(H) 2 3/10 2/5 4 1/5 1/10 9. Find the mean ...
A:
Q: Table 2. Total oil production in millions of tons for Saudi Arabia from 1996-2013 Forecast Demand, F...
A: The forecasting for the total oil production (in millions) is to be concluded using the simple expon...
Q: For a moderately skewed data, the arithmetic mean is 200, the coefficient of variation is 8 and Karl...
A:
Q: Attempt the following: (i) P(A) = 0.75, P(B) = 0.50 and P(A U B) = 0.87, are the events A and B inde...
A: Given,P(A)=0.75 , P(B)=0.50 AND P(A∪B)=0.87
Q: The equation y = 6.758x + 50 represents the relationship between the weight of the sharks and the le...
A:
Q: Suppose you are in a dark room, and you bumped into three identical urns A, B, and C, which contain ...
A: Hello! As you have posted more than 3 sub parts, we are answering the first 3 sub-parts. In case yo...
Q: Let’s consider whether U.S. college football teams differ in the likelihood of being mismatched in t...
A:
Q: The teacher selects 10 left-handed and 10 right-handed students. What type of sampling was being use...
A: The teacher selects 10 left-handed and 10 right-handed students. What type of sampling was being use...
Q: 8. Which of the following does not represent an example of a discrete probability distribution? c. 6...
A: Given We want choose appropriate option for given statement.
Q: tatistics department purchased 24 calculators from a dealer in order to have a supply on hand for st...
A: Hi! Thank you for the question, As per the honor code, we are allowed to answer one question at a ti...
Q: American Theatre owners knew that a certain hit movie ran an average of 84 days or more in each city...
A:
Q: A famous artist wishes to insure his dog for half a million pesos. The insurance company estimates t...
A:
Q: The National Longitudinal Study of Adolescent Health interviewed a random sample of 4877 teens (grad...
A: Note: Since the two-way table and answer choices are missing we have provided the general answer for...
Q: The Graded Naming Test (GNT) is used when diagnosing cognitive deficits of the sort that can occur a...
A:
Q: Suppose that the amount of time that students spend studying in the library in one sitting is normal...
A: GivenMean(μ)=45standard deviation(σ)=20sample size(n)=17
Q: - Calculate mean deviation from the following series: 10 11 12 13 14 Y 3 12 18 12 3
A:
Q: Find the upper and lower outlier boundaries. Nuclear power: The following table presents the number ...
A: Outliers are extreme values .It increases the error variance and reduces the power of statistical te...
Q: Customers aTive at a shopping mall by bus, or in their own cars, or by taxi, in the relative quantit...
A:
Q: A survey was conducted to determine the proportion of Grade 11 students who engage in under-age alco...
A: We have given that p = 0.70 n = 100 We have to calculate P(x> 0.65)
Q: 4. VariablesM and N are O A. both qualitative O B. both quantitative O C. quantitative and qualitati...
A: In the specified problem, the variables, which are used here to study the characteristics of the pat...
Q: Express the confidence interval 0.175 + 0.064 in open interval form (i.e., (0.155,0.855), Question H...
A:
Q: 10. Which of the following is the most appropriate graph to compare th average number of mayas among...
A: Bar graphs are used to compare things between different groups or to track changes over time.
Q: The average age of senior high studenĖs is 20.8 years. Two-tailed One -tailed The average salary of ...
A: Given: a) Average age is 20.8 years b)The average salary is less than 25300 c)Average age is greater...
Q: Suburb After Before Diff Burr Oak 4 4 0 Elgin Corners 1 2 -1 Elm Grove 8 3 5 Greenbu...
A:
Q: Refer to the following scenario. A government official is in charge of allocating social programs t...
A:
Q: B. Determine whether the pair of measures of angles are complementary or supplementary.
A:
Q: II. Supply the missing data Class Interval (CI) Class size (c) Classmark/Midpoint (X LL UL а. 15 27 ...
A:
Q: Consider the following regression result is1- i4: = -.08 - .05((ia-)/3) (2.3) (1.4) Where as usual i...
A: Given Regression result i3,t+1-i4,t=-.08-.05{(i4,t-it)/3}
Q: 2. Which of the following illustrate(s) inferential statistics? I. Using data from the 2000 Family I...
A: Inferential statistics is involved in drawing inferences about the population from the sample, which...
Q: _17. X 4 6 8 10 P(X) -0.6 0.2 0.7 1.5 _18. 3 4 P(X) 4 4 _19. 8 9 12 P(X) _20. 3 7 P(X) 0.3 0.1 0.2 0...
A:
Q: Differentiate Experimental Method and Quasi-experimental method by giving an example or an applicati...
A: An experimental design is a research study that involves random selection of subjects, assigning the...
Q: Attempt the following: (i) P(A) = 0.75, P(B) = 0.50 and P(A U B) = 0.87, are the events A and B inde...
A:
Q: (a) Identify H0 and Ha. (b) Find the critical value(s). Select the correct choice below and fill ...
A: Since you have posted a question with multiple sub-parts, we will solve first three subparts for you...
Q: In a random experiment, two fair dice are tossed and the sum of the two dice (i.e., the sum of the n...
A: Probability : Probability is defined as a event which is going to happened. it always lies between 0...
Q: Suppose that a normal distribution has a mean of 57 and a standard deviation of 10.2. Between what x...
A:
Q: Compute the least-squares regression equation for the given data set. Round the slope and y-intercep...
A: We have given that, X:- 4, 7, 3, 1, 5 Y:- 3, 5, 6, 7, 2 Then, We will find the least- square regre...
Q: Blood pressure in men: The three quartiles for systolic blood pressure in a sample of 3184 men were ...
A: Given,Q1=97Q2=116Q3=135
Q: Suppose that on a typical day, 18 cats are presented to a veterinary clinic, and six are seen to hav...
A: Disclaimer : Since you have asked multiple question, we will solve the first question for you. If yo...
Q: Explain, giving reasons, which is more important, applied or basic research
A: Applied Research (AR) and Basic Research (BR) are techniques of research.
Q: Suppose a certain machine produces 100 products, 20 of them are deffective. If two products are rand...
A: Given : Suppose a certain machine produces 100 products i.e Population size (N) = 100 20 of them are...
Q: A cigarette manufacturer sent each of two laboratories presumably identical samples of tobacco. Each...
A: Introduction: Denote μ1, μ2 as the true population mean nicotine content in the tobacco samples sent...
Q: Attempt the following: (i) P(A) = 0.75, P(B) = 0.50 and P(A U B) = 0.87, are the events A and B inde...
A:
Q: The weights of bags of baby carrots are normally distributed, with a mean of 29 ounces and a standa...
A:
Q: In an experiment on pea-breeding Mendel obtained the following frequencies of seed : 315 round and y...
A:
Q: - In a classroom with two students, find the mean of the number of students who will be boys. The pr...
A: Given that n=2 , p=1/2=0.5 , q=1-p=1-0.5=0.5 X~Binomial(n=2 , p=0.5) p=Probability of boy X=Number ...
Q: The figures given below are (a) the theoretical trequencies of a distribution, and (b) the frequenci...
A:
Q: An agronomist wants to compare the crop yield of 3 varieties of chickpea seeds. She plants 15 fields...
A: Given: Trial Smith Walsh Trevor 1 11.1 19 14.6 2 13.5 18 15.7 3 15.3 19.8 16.8 4 14.6 ...
Q: A researcher was interested in studying if there is a significant relationship between the severity ...
A: According to the answering guidelines, we can answer only three subparts of a question and the rest ...
Q: The following are the number of customers who bought milktea during MGCQ and GCQ. MGCQ: 10, 15, 19, ...
A: Answer :
Give a brief analysis on the graph given in the picture by using the data (Dominant behaviors of reisdent male with or without injecting octopamine)

Step by step
Solved in 2 steps

- Neutropenia. Neutropenia is an abnormally low number of neutrophils (a type of white blood cell) in the blood. Chemotherapy often reduces the number of neutrophils to a level that makes patients susceptible to fever and infections. G. Bucaneve et al. published a study of such cancer patients in the paper “Levofloxacin to Prevent Bacterial Infection in Patients With Cancer and Neutropenia” (New England Journal of Medicine, Vol. 353, No. 10, pp. 977–987). For the study, 375 patients were randomly assigned to receive a daily dose of levofloxacin, and 363 were given placebo. In the group receiving levofloxacin, fever was present in 243 patients for the duration of neutropenia, whereas fever was experienced by 308 patients in the placebo group. a. At the 1% significance level, do the data provide sufficient evidence to conclude that levofloxacin is effective in reducing the occurrence of fever in such patients? b. Find a 98% confidence level for the difference in the proportions of such…Using the students’ T test determine whether test agent causes significant inhibition of colony formationLearning math Developers of a new math curriculumcalled “Accelerated Math” compared performances ofstudents taught by their system with control groups ofstudents in the same schools who were taught using traditional instructional methods and materials. Statis-tics about pretest and posttest scores are shown in the table. (J. Ysseldyke and S. Tardrew, Differentiating MathInstruction, Renaissance Learning, 2002)a) Did the groups differ in average math score at thestart of this study? b) Did the group taught using the Accelerated Math pro-gram show a significant improvement in test scores? c) Did the control group show a significant improve-ment in test scores? d) Were gains significantly higher for the AcceleratedMath group than for the control group? Instructional MethodAcc. math ControlNumber of students 231 245Pretest Mean 560.01 549.65St. Dev 84.29 74.68Post-test Mean 637.55 588.76St. Dev 82.9 83.24Individual gain Mean 77.53 39.11St. Dev. 78.01 66.25
- Anxiety disorders and symptoms can often be effectivelytreated with benzodiazepine medications. It isknown that animals exposed to stress exhibit adecrease in benzodiazepine receptor binding in thefrontal cortex. The article “Decreased BenzodiazepineReceptor Binding in Prefrontal Cortex in Combat-Related Posttraumatic Stress Disorder” (Amer. J.of Psychiatry, 2000: 1120–1126) described the firststudy of benzodiazepine receptor binding in individualssuffering from PTSD. The accompanying data on areceptor binding measure (adjusted distribution volume)was read from a graph in the article.PTSD: 10, 20, 25, 28, 31, 35, 37, 38, 38, 39, 39,42, 46Healthy: 23, 39, 40, 41, 43, 47, 51, 58, 63, 66, 67,69, 72Use various methods from this chapter to describe andsummarize the data.Specificity of the association is best described as A. when the value of the response variable changes in a meaningful way with the dosage of the suspected cause. B. when the suspected cause precedes the response variable. C. when similar studies produce similar results. D. when all other possible causes are ruled out.A driver's ability to detect highway signs is an important consideration in highway safety. In his dissertation, S. Younes investigated the distance at which drivers can first detect highway caution signs. This distance is called the detection distance. Younes analyzed the effect that sign size and sign material have on detection distance. Drivers were randomly assigned to one combination of sign size (small, medium, and large), and sign material (1, 2, and 3). Each driver covered the same stretch of highway at a constant speed during the same time of day, and the detection distance, in feet, was determined for the driver's assigned caution sign.
- Fast reactions: In a study of reaction times, the time to respond to a visual stimulus x and the time to respond to an auditory stimulus y were recorded for each of 7 subjects. Times were measured in thousandths of a second. The results are presented in the following table. The results are presented in the following table. Visual Auditory 176 163 201 197 188 193 228 209 211 189 203 206 191 169 Compute the least-squares regression line for predicting the time to respond to an auditory (y) from the time to respond to a visual stimulus (x). Round the slope and y-intercept values to at least four decimal places.a) State the null and alternative hypothesisb) Determine the critical value by using t-tablec) Determine the rejection regiond) Calculate the Test statisticRock Sparrows. Rock Sparrows breeding in northern Italy are the subject of a long-term ecology and conservation study due to their wide variety of breeding patterns. Both males and females have a yellow patch on their breasts that is thought to play a significant role in their sexual behavior. A. Pilastro et al. conducted an experiment in which they increased or reduced the size of a female’s breast patch by dying feathers at the edge of a patch and then observed several characteristics of the behavior of the male. Their results were published in the paper “Male Rock Sparrows Adjust Their Breeding Strategy According to Female Ornamentation: Parental or Mating Investment?” (Animal Behaviour,Vol. 66, Issue 2, pp. 265–271). Eight mating pairs were observed in each of three groups: a reduced-patch-size group, a control group, and an enlarged-patch-size group. The data on the WeissStats site, based on the results reported by the researchers, give the number of minutes per hour that males…
- Fast reactions: In a study of reaction times, the time to respond to a visual stimulus x and the time to respond to an auditory stimulus y were recorded for each of 8 subjects. Times were measured in thousandths of a second. The results are presented in the following table. The results are presented in the following table. Use the TI-84 calculator. Visual Auditory 161 159 176 163 178 201 188 193 191 169 211 189 235 241 228 209 Compute the least-squares regression line for predicting the time to respond to an auditory (y) from the time to respond to a visual stimulus (x). Round the slope and y-intercept values to at least four decimal places.Ground Water. The U.S. Geological Survey, in cooperation with the Florida Department of Environmental Protection, investigated the effects of waste disposal practices on ground water quality at five poultry farms in north-central Florida. At one site, they drilled four monitoring wells, numbered 1, 2, 3, and 4. Over a period of 9 months, water samples were collected from the last three wells and analyzed for a variety of chemicals, including potassium, chlorides, nitrates, and phosphorus. The concentrations, in milligrams per liter, are provided on the WeissStats site. For each of the four chemicals, decide whether the data provide sufficient evidence to conclude that a difference exists in mean concentration among the three wells. Use α = 0.01. [SOURCE: USGS Water Resources Investigations Report 95-4064, Effects of Waste-Disposal Practices on Ground- Water Quality at Five Poultry (Broiler) Farms in North-Central Florida, H. Hatzell, U.S. Geological Survey] a. conduct a one-way ANOVA…Teaching Duties. Contingent faculty members in higher education are non-tenure track faculty, adjuncts, postdocs, lecturers, or instructors. R. Bowden and L. Gonzalez researched whether contingent faculty members are different from tenure-track faculty members with regards to teaching, research, and service in the article “The Rise of Contingent Faculty: Its Impact on the Professoriate and Higher Education” (Journal of Applied Research in Higher Education, Vol. 4, No. 1, pp. 5–22). A hypothesis test was conducted to decide whether the mean number of classes taught for credit per semester was less for contingent faculty than for tenure-track faculty. a. identify the variable. b. identify the two populations. c. determine the null and alternative hypotheses. d. classify the hypothesis test as two tailed, left tailed, or right tailed.
