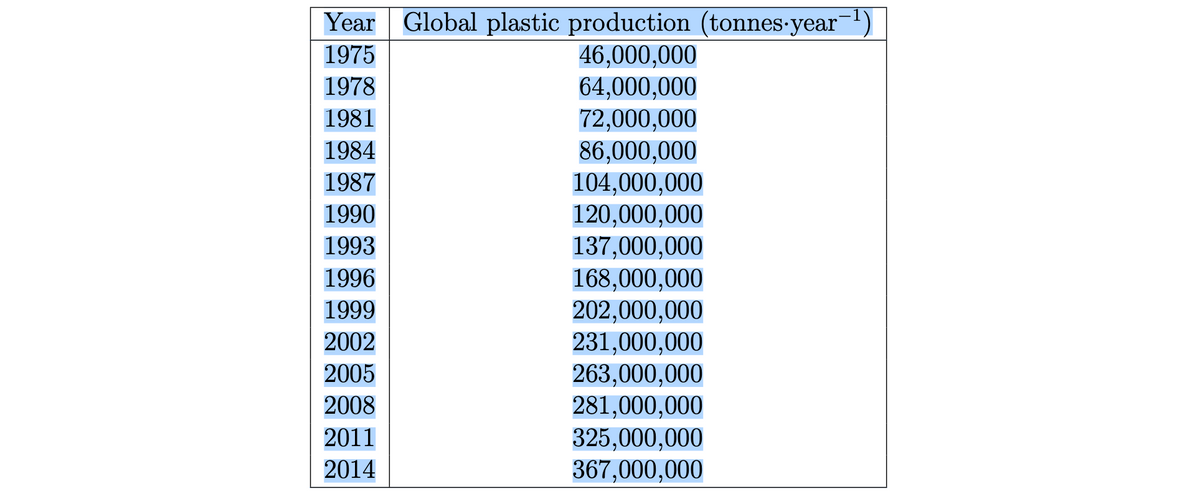
design a linear model for this data and jusify this mode(state why it is better to use this model than others


Q: Let X₁, X2,..., Xn be a random sample from Uniform(a - B, a + B) (a) Compute the method of moments…
A: It is given that X1, X2,...., Xn is a random sample from Uniformα-β, α+β.
Q: The information below is very:1. Arithmetic mean 2. Standard deviation 3. Skew modulus 4. Flatness…
A: Hey!! We have given speed range(km/hr) and frequency so we'll find the Arithmatic mean, Standard…
Q: 1. Given the data: 29.65 28.55 30.65 28.15 29.65 30.45 31.25 29.45 Determine coefficient of…
A:
Q: Solve the following problems write your complete solutions 1. The number of lots sold by each of the…
A: Note: As per the guidelines only 1 question can be answered. Kindly, resubmit with note for other…
Q: The marks on a statistics midterm test are normally distributed with a mean of 78 and a standard…
A:
Q: Illustration 17.30. A distribution is known to be normal. The quartiles are 8.64 and 14.32.…
A:
Q: You measure 20 dogs weights and find they have a mean weight of 48 pounds. Assume the population…
A:
Q: students at Harvard to answer this question. Use a DAG to illustrate your research question and…
A: Research Research as a scientific and systematic approach for pertinent information on a specific…
Q: he wants to serve 3 bottles of zinfandel and serving order is important, how many ways are there to…
A: Given Number of zinfondel bottles z=11 Number of Merlot bottles m =7 Number of cobernet bottles c=13…
Q: Find the levels of the Confidence intervals that have the given Critical Values. 1.04 Tipos Allomal…
A: Given Critical value =1.04
Q: 300 250 200 150 100 Disney Animated Film Ratings
A: The objective is to answer the questions based on the given graph on which the x-axis represents the…
Q: According to previous studies, 12% of the U.S. population is left-handed. Not knowing this, a high…
A:
Q: Suppose the value of Young's modulus (GPa) was determined for cast plates consisting of certain…
A: Given 116.2 115.5 114.7 115.2 115.6
Q: Lemon Imports 234 284 352 483 511 Find the equation of the regressionne 16.1 16 15.8 15.6 15.1 Round…
A:
Q: Draw the normal curve. Given a normal distribution with population mean is 21 and population…
A: Solution-: Given: μ=21,σ2=64 ∴σ=8 We find x such that, P[X>x]=0.51
Q: -t Leaf Plot
A: Question : Which graphs are used for categorical data?
Q: Write a point estimator and an interval estimator for the mean.
A: We need to write a point estimator and an interval estimator for the mean.
Q: 3. a = 0.005, right-tailed 4. α=0.04, two-tailed 0.03 right-tailed
A:
Q: (kindly provide complete and full solution. i won't like your solution if it is incomplete or not…
A: id name 2005 2006 2007 2008 2009 2010 2011 1 Atlanta 85 38 75 30 9 15 38 2 chicago 28 29 38 26…
Q: For items 7 to 10, consider the scores 70 Grade 10 students in Mathematics Test. Scores Less than…
A: Given data is Scores Frequency Lower Boundaries Less than CF 95-99 3 94.5 70 90-94 6 89.5 67…
Q: The estimated regression line: a. does not change the sum of squared residuals. b. maximizes…
A: It is given that the statement about to the estimated regression line. Here, need to find out the…
Q: Which graphs are best for showing central tendency and spread of data.
A: The graph is best shown in central tendency and spread of data. Histogram when a histogram has…
Q: The accompanying specific gravity values describe various wood types used in construction. 0.34 0.35…
A: Given that: 0.34 0.35 0.36 0.36 0.37 0.38 0.40 0.40 0.40 0.41 0.41 0.42 0.42 0.42 0.42 0.42…
Q: 4. Which of the following statements about measures of variability must always be true if the…
A: Options c and d are correct.
Q: The mean and standard deviation of a population are 200 and 20, respectively. The probability of…
A: Since you have asked multiple question, we will solve the first question for you. If you want any…
Q: Suppose that vehicles taking a particular freeway exit can turn right (R), turn left (L), or go…
A: See the below solution
Q: Risk taking is an important part of investing. In order to make suitable investment decisions on…
A: Solution
Q: Use a graphing calculator to find a linear regression model for the men's 100-meter freestyle data…
A: Each regression equation has two regression coefficients, they are slope and intercept. Regression…
Q: Given the joint pdf of X and Y is fxy(x, y) Find P(X>Y). = -{abe abe-(ax+by) x>0, y>0 otherwise
A:
Q: Below is a table that shows samples of computed p values and the corresponding level of…
A: Decision rule is that the null hypothesis is rejected if the p-value is less than or equal to the…
Q: 1. Given the data: 29.65 30.65 29.65 31.25 Determine 28.55 28.15 30.45 29.45 28.65 29,85 29.15 30.15…
A: Given data…
Q: Draw the normal curve. Suppose that the amount of time it takes the Bureau of Internal Revenue…
A: Solution-: Given: μ=14,σ=1.5 We want to find x such that, P[X<x]=0.45
Q: (7) 15pts. The sales table is piled with sweaters. The sweaters are wool, dacron or cotton, and…
A: Given problem Given that The sales table is piled with sweaters. The sweaters are wool, dacron…
Q: Match the level of measurement with the variables or measures listed. Length of hospital stay Income…
A: Given that:Four level of measurement:A. NominalB. IntervalC. Ratio D. Ordinal10 different variables…
Q: Mercury is a persistent and dispersive environmental contaminant found in many ecosystems around the…
A: (a) The sample mean is, x=∑xn =18.5915 =1.2393 The sample mean is 1.2393.
Q: 4. Is there a significant relationship between the father's weight and his newborn son's weight?…
A: Use the Excel and Perform the Regression. Followings are the Steps to perform the Regression 1) Open…
Q: Automotive Engineers tested the gas mileage in kilometers per Liter (km/L) of a certain passenger…
A: The provided information is x¯=15s2=2.5s=1.58n=25α=0.001 df =n-1=25-1 df=24 The critical value is…
Q: 1. What is the correlation coefficient for the bivariate data? [Select] ✪ 2. What is the strength of…
A: Use the Excel and Calculate the Correlation Followings are the Steps to Calculate Correlation 1)…
Q: To boost sinking sales, a cola company has decided to market a new product: invisible cola. To test…
A:
Q: In a recent study, a scientist was interested in investigating whether there is a significant…
A: Solution
Q: What is the symbol n 3.2 after the word at
A:
Q: Hey, how did you get the table comparing the sales amount between for male and females on…
A: Here we should compare the sales amount between for male and females. Given data Transaction ID…
Q: 2.5 interpret the correlation coefficient calculate in question 2.4 above 2.6 Predict the number of…
A: Regression is usually used to predict the variable over the other. It is combined by the regression…
Q: In 2014, approximately 13% of nonelderly Americans adults had no health insurance. Suppose that a…
A: Given: Proportion of American adults having no health insurance, p=0.13 Sample size, n=400
Q: Vrite a set of 6 unique numbers that is skewed to the left and has a mean of 6 and a median of 8.
A: Solution
Q: Question Time remaining 01:18:48 An epidemiologist wanted to determine the disease specific…
A: Here's, disease specify mortality rate, we take for one year per 1000 people.
Q: CASE 2 Top 3 disease 2018 and 2021 (Disease 1, 2, 3) 2018 2021 Ischemic Heart Disease 88,400 125,913…
A: The question is about demography Given :
Q: If X is a normally distributed random variable with a mean of 80 and a standard deviation of 12,…
A: Given that. X~N( μ , ?^2 ) μ=80 , ?=12 Z-score =( x - μ )/?
Q: Height 177-183 170-176 163-169 156-162 149-155 142-148 135-141 What is the upper class boundary of…
A: We have given the following data .
Q: Below are Means for 2x2 ANOVA. Which missing value would result in no main effect for Stress levels.…
A: Given, Below are Means for 2x2 ANOVA. Low stress High stress Female 4 6 Male 8 ?
design a linear model for this data and jusify this

Step by step
Solved in 3 steps with 1 images

- Country Birth rate GNP Growth Income ratio Bangladesh 47 140 0.3 2.3 Tanzania 47 280 1.9 3.2 Sierra Leone 46 320 0.4 3.3 Sudan 47 380 -1.3 3.9 Kenya 55 380 2.9 6.8 Indonesia 35 530 4.1 3.4 Panama 30 1910 3.1 8.6 Chile 25 2560 0.7 3.8 Venezuela 35 4220 2.4 4.9 Turkey 33 1540 3.5 4.9 Malaysia 31 1840 4.3 5 Nepal 44 150 0 4.7 Malawi 56 200 2.7 2.4 Argentina 20 2560 1.9 3.6 Test for the joint significance of the coefficients on growth and the income ratio. What other possible explanatory variables do you think it might be worth investigating?Year Population 1790 3,929,214 1800 5,308,483 1810 7,239,881 1820 9,638,453 1830 12,866,020 1840 17,069,453 1850 23,191,876 1860 31,443,321 1870 39,818,449 1880 50,155,783 1890 62,947,714 1900 75,994,575 1910 91,972,266 1920 105,710,620 1930 122,775,046 1940 131,669,275 1950 150,697,361 1960 179,323,175 1970 203,302,031 1980 226,545,805 1990 248,709,873 2000 281,421,906 2010 308,745,538 What is the equation of the Least Squares Regression Line for the census data? (need to include correct values for a and b) Using the line, you calculated in number 5, what would you predict the population to have been in 1985? EXPLAIN. Should you use the previously calculated Regression Line to predict population in the year 2200? EXPLAIN.Year Population 1790 3,929,214 1800 5,308,483 1810 7,239,881 1820 9,638,453 1830 12,866,020 1840 17,069,453 1850 23,191,876 1860 31,443,321 1870 39,818,449 1880 50,155,783 1890 62,947,714 1900 75,994,575 1910 91,972,266 1920 105,710,620 1930 122,775,046 1940 131,669,275 1950 150,697,361 1960 179,323,175 1970 203,302,031 1980 226,545,805 1990 248,709,873 2000 281,421,906 2010 308,745,538 Use excel to calculate the Least Squares Regression Line for the census data? (need to include correct values for a and b) Using the line, you calculated in number 5, what would you predict the population to have been in 1985? EXPLAIN. Should you use the previously calculated Regression Line to predict population in the year 2200? EXPLAIN.
- Year Population 1790 3,929,214 1800 5,308,483 1810 7,239,881 1820 9,638,453 1830 12,866,020 1840 17,069,453 1850 23,191,876 1860 31,443,321 1870 39,818,449 1880 50,155,783 1890 62,947,714 1900 75,994,575 1910 91,972,266 1920 105,710,620 1930 122,775,046 1940 131,669,275 1950 150,697,361 1960 179,323,175 1970 203,302,031 1980 226,545,805 1990 248,709,873 2000 281,421,906 2010 308,745,538 Submit a scatterplot of the above data Calculate the correlation (r) for the above data set. What does (r) tell us about the association of this data? EXPLAIN. What does (r) tell us about the strength of the correlation of the above data? EXPLAIN. What is the equation of the Least Squares Regression Line for the census data? (need to include correct values for a and b) Using the line, you calculated in number 5, what would you predict the population to…Price Age Mileage13590 6 6148513775 6 5434422991 1 824615303 4 2485616388 3 2210016600 3 2370216987 4 4740118489 2 1688818859 3 3538019857 3 2963411877 9 5579214989 3 4618315900 3 3700916500 4 455219440 9 8690212988 5 7724115777 6 5964710490 9 932418938 10 4822111988 8 42408 The accompanying table shows a portion of data consisting of the price, the age, and the mileage for 20 used sedans. Price Age Mileage 13590 6 61485 13775 6 54344 ⋮ ⋮ ⋮ 11988 8 42408 Determine the sample regression equation that enables us to predict the price of a sedan on the basis of its age and mileage. (Negative values should be indicated by a minus sign. Round your answers to 2 decimal places.) [If you are using R to obtain the output, then first enter the following command at the prompt: options(scipen=10). This will ensure that the output is not in scientific…Sheet Thickness 1 0.0403 2 0.0693 3 0.0632 4 0.0651 5 0.0534 6 0.0574 7 0.0400 8 0.0515 9 0.0542 10 0.0555 11 0.0512 12 0.0525 13 0.0434 14 0.0392 15 0.0607 16 0.0575 17 0.0637 18 0.0358 19 0.0455 20 0.0319 21 0.0578 22 0.0488 23 0.0402 24 0.0318 25 0.0447 26 0.0306 27 0.0325 28 0.0542 29 0.0416 30 0.0517 31 0.0448 32 0.0520 33 0.0495 34 0.0525 35 0.0618 36 0.0571 37 0.0391 38 0.0655 39 0.0568 40 0.0370 41 0.0505 42 0.0425 43 0.0611 44 0.0491 45 0.0574 46 0.0603 47 0.0420 48 0.0616 49 0.0463 50 0.0340 51 0.0609 52 0.0457 53 0.0409 54 0.0367 55 0.0713 56 0.0576 57 0.0515 58 0.0549 59 0.0325 60 0.0470 61 0.0203 62 0.0379 63 0.0442 64 0.0384 65 0.0409 66 0.0358 67 0.0442 68 0.0538 69 0.0486 70 0.0317 71 0.0529 72 0.0449 73 0.0437 74 0.0384 75 0.0400 76 0.0397 77 0.0486 78 0.0296 79 0.0548 80 0.0407 81 0.0552 82 0.0412 83…
- year Income ($) B P1994 6036 85.1 20.41995 6113 87.8 20.21996 6271 88.9 21.31997 6378 94.5 19.91998 6727 99.9 181999 7027 99.5 19.92000 7280 104.2 22.22001 7513 106.5 22.32002 7728 109.7 23.42003 7891 110.8 26.22004 8134 113.7 27.12005 8322 113 292006 8562 116 33.52007 9042 108.7 42.82008 8867 115.4 35.62009 8944 118.9 32.22010 9175 127.4 33.72011 9381 123.5 34.42012 9735 117.9 48.52013 9829 105.4 66.12014 9722 103.2 62.42015 9769 104.2 58.62016 9725 103.7 56.72017 9930 105.7 55.52018 10419 105.5 57.32019 10625 106.5 53.72020 10905 107.3 52.6 Make a forecast of Mr. X's Income for the next five years Make forecast of income for the given values of B =110 and P = 55Earnings and Height Earnings Height Sex 84004.75 59 0 84075.75 59 0 7822.854004 59 0 84110.75 59 0 84098.75 60 0 44138.16016 60 0 17116.26367 60 0 84070.75 60 0 84058.75 60 0 84089.75 60 0 38917.33594 60 0 33729.96875 60 0 44165.16016 61 0 33715.96875 61 0 49407.10938 61 0 84118.75 61 0 33613.96875 61 0 28509.38672 61 0 44145.16016 61 0 84033.75 61 0 44218.16016 61 0 33661.96875 61 0 84025.75 61 0 84117.75 61 0 28601.38672 61 0 33784.96875 61 0 49462.10938 61 0 33632.96875 62 0 18198.8418 62 0 44153.16016 62 0 83967.75 62 0 83994.75 62 0 44121.16016 62 0 83961.75 62 0 10807.42871 62 0 83980.75 62 0 23410.87305 62 0 38952.33594 62 0 84014.75 62 0 83979.75 62 0 84043.75 62 0 23369.87305 62 0 44170.16016 62 0 84056.75 62 0 44205.16016 62 0 84100.75 62 0 84116.75 62 0 23388.87305 62 0 23400.87305 63 0 49370.10938 63 0 9938.505859 67 1 84063.75 67 1 23422.87305 67 1 38867.33594…ore analysis reserve
- Age Male Females 21 0.001420 0.000472 22 0.001488 0.000487 23 0.001502 0.000496 24 0.001474 0.000503 25 0.001430 0.000509 26 0.001393 0.000519 27 0.001366 0.000535 28 0.001362 0.000561 29 0.001379 0.000595 30 0.001406 0.000637 A- a 23 year old female pays $275 for 1-year $150,000 life insurance policy. what is the expected value of the policy fo the policyholder? B- a 23 year old female pays $275 for 1-year $150000.00 life insurane policy what is the expected value of the policy for the insurance company?Price SqFt 600000 2767 545000 2731 314900 2051 419000 2084 365000 2270 479000 1950 323000 1235 339900 2116 399000 1644 552000 2415 223017 1375 315777 1529 499000 2223 575000 2327 342000 1879 375000 1558 349000 2012 485000 1200 549888 1410 295000 1943 399000 1827 306999 1840 265200 1636 479000 2357 249700 1152 539500 2650 365000 2154 295900 1279 499000 2156 526000 2493 514900 2390 346000 1347 460000 2120 389000 1917 499000 1200 405000 2643 389900 1789 545000 2327 339000 1742 425000 1746 479000 1421 392000 2569 Interpret b0 in the context of this problem. Interpret b1 in the context of this problem. What percent of total variation in prices is explained by the regression model? Provide evidence to support your answer. Please include the excel function.Expenses MSA Expenses Regular Health MSA Health Regular 413.92 597.83 2 2 150.55 353.84 1 1 287.26 540.03 1 1 609.82 551.42 2 2 358.9 620.41 2 1 317.87 507.36 1 1 415.75 507.05 2 1 256.73 673.14 2 1 429.24 525.77 1 1 0 333.1 2 2 429.23 383.78 1 1 598.42 616.68 1 1 424.7 460.88 1 1 293.94 223.27 1 1 25.5 559.87 1 1 481.93 579.1 1 1 347.73 447.95 1 1 235.12 476.57 1 1 353.91 408.15 1 2 197.22 397.14 1 1 125.61 415.49 1 1 376.86 517.23 1 2 337.36 404.87 1 1 481.22 639.35 1 1 367.8 454.03 1 2 164.3 289.86 2 1 330.54 546.59 1 1 338.36 361.42 1 1 187.62 518.18 2 2 292.97 561.44 1 1 384.85 482.4 1 1 286.55 361.51 1 1 566.91 658.18 2 2 225.1 590.34 2 1 148.96 584.15 1 1 373.36 665.71 1 1 168.28 468.04 1 1 281.64 247.68 1 1 555.2 331.35 1 1 354.1 391.79 1 1 409.97 433.39 1 1 605.43 403.15 1 1 440.25 416.28 2 1 513.88 645.89 1 1 348.7 820.4 1 2 431.81 682.14 1 1 205.47 254.64 1 1 304.87 627.84 1 1…


