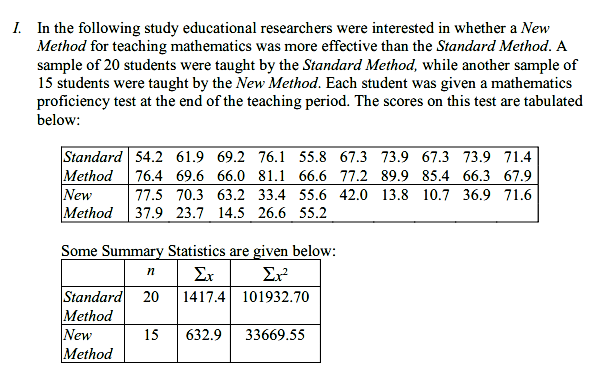
Determine the Interquartile Range (IQR) of math proficiency scores of students taught by the Standard Method. Determine the standard deviation (s) of math proficiency scores of students taught the Standard Method.

Holt Mcdougal Larson Pre-algebra: Student Edition 2012
1st Edition
ISBN:9780547587776
Author:HOLT MCDOUGAL
Publisher:HOLT MCDOUGAL
Chapter11: Data Analysis And Probability
Section: Chapter Questions
Problem 8CR
icon
Related questions
icon
Concept explainers
Topic Video
Question
I. In the following study educational researchers were interested in whether a New
Method for teaching mathematics was more effective than the Standard Method. A
sample of 20 students were taught by the Standard Method, while another sample of
15 students were taught by the New Method. Each student was given a mathematics
proficiency test at the end of the teaching period. The scores on this test are tabulated
below:
Standard 54.2 61.9 69.2 76.1 55.8 67.3 73.9 67.3 73.9 71.4
Method
New
Method
76.4 69.6 66.0 81.1 66.6 77.2 89.9 85.4 66.3 67.9
77.5 70.3 63.2 33.4 55.6 42.0 13.8 10.7 36.9 71.6
37.9 23.7 14.5 26.6 55.2
Some Summary Statistics are given below:
Er
Ex?
Standard 20
Method
New
Method
1417.4 101932.70
15
632.9
33669.55
Transcribed Image Text:I. In the following study educational researchers were interested in whether a New Method for teaching mathematics was more effective than the Standard Method. A sample of 20 students were taught by the Standard Method, while another sample of 15 students were taught by the New Method. Each student was given a mathematics proficiency test at the end of the teaching period. The scores on this test are tabulated below: Standard 54.2 61.9 69.2 76.1 55.8 67.3 73.9 67.3 73.9 71.4 Method New Method 76.4 69.6 66.0 81.1 66.6 77.2 89.9 85.4 66.3 67.9 77.5 70.3 63.2 33.4 55.6 42.0 13.8 10.7 36.9 71.6 37.9 23.7 14.5 26.6 55.2 Some Summary Statistics are given below: Er Ex? Standard 20 Method New Method 1417.4 101932.70 15 632.9 33669.55
. Determine the Interquartile Range (IQR) of math proficiency scores of students
taught by the Standard Method.
Determine the standard deviation (s) of math proficiency scores of students taught E
the Standard Method.
Choices
a)
50.2
b) 14.5
g) 29.26
c) 66.80
h) 35.70
d) 8.83
i) 22.31
e) 9.80
f)
7.26
j) 39.50
Transcribed Image Text:. Determine the Interquartile Range (IQR) of math proficiency scores of students taught by the Standard Method. Determine the standard deviation (s) of math proficiency scores of students taught E the Standard Method. Choices a) 50.2 b) 14.5 g) 29.26 c) 66.80 h) 35.70 d) 8.83 i) 22.31 e) 9.80 f) 7.26 j) 39.50
Expert Solution
steps

Step by step

Solved in 3 steps with 6 images

Blurred answer
Knowledge Booster
Centre, Spread, and Shape of a Distribution
Learn more about
Need a deep-dive on the concept behind this application? Look no further. Learn more about this topic, statistics and related others by exploring similar questions and additional content below.
Recommended textbooks for you
Holt Mcdougal Larson Pre-algebra: Student Edition…
Algebra
ISBN:
9780547587776
Author:
HOLT MCDOUGAL
Publisher:
HOLT MCDOUGAL
Glencoe Algebra 1, Student Edition, 9780079039897…
Algebra
ISBN:
9780079039897
Author:
Carter
Publisher:
McGraw Hill