Problems 11-12 The stock price of a popular tech company traded on the NSADAQ traded at $75 in 2014 (t = 0), $100 in 2016 (t = 2), and $175 in 2018 (t = 4). The parabolic growth curve is valid through 2022. An online video streaming company, also traded on the NASDAQ, traded at $50 in 2015 (t = 1) and $200 in 2018 (t = 4). The linear growth curve is valid through 2022. 11. At what times do the tech company and the streaming company have the same stock price? 12 Use a graph of the system to determine the interval(s) over which the tech company's stock price is higher than the streaming company's stock price.
Problems 11-12 The stock price of a popular tech company traded on the NSADAQ traded at $75 in 2014 (t = 0), $100 in 2016 (t = 2), and $175 in 2018 (t = 4). The parabolic growth curve is valid through 2022. An online video streaming company, also traded on the NASDAQ, traded at $50 in 2015 (t = 1) and $200 in 2018 (t = 4). The linear growth curve is valid through 2022. 11. At what times do the tech company and the streaming company have the same stock price? 12 Use a graph of the system to determine the interval(s) over which the tech company's stock price is higher than the streaming company's stock price.

Algebra and Trigonometry (MindTap Course List)
4th Edition
ISBN:9781305071742
Author:James Stewart, Lothar Redlin, Saleem Watson
Publisher:James Stewart, Lothar Redlin, Saleem Watson
Chapter10: Systems Of Equations And Inequalities
Section10.FOM: Focus On Modeling: Linear Programming
Problem 14P

Related questions
Question
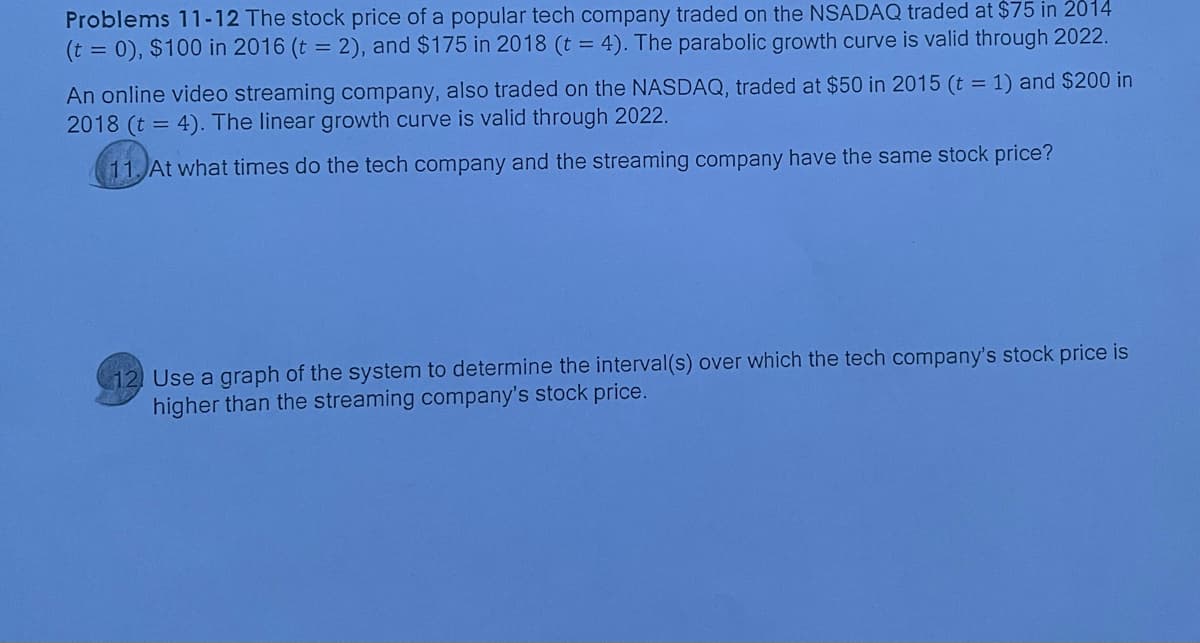
Transcribed Image Text:Problems 11-12 The stock price of a popular tech company traded on the NSADAQ traded at $75 in 2014
(t = 0), $100 in 2016 (t = 2), and $175 in 2018 (t = 4). The parabolic growth curve is valid through 2022.
An online video streaming company, also traded on the NASDAQ, traded at $50 in 2015 (t = 1) and $200 in
2018 (t = 4). The linear growth curve is valid through 2022.
11. At what times do the tech company and the streaming company have the same stock price?
12 Use a graph of the system to determine the interval(s) over which the tech company's stock price is
higher than the streaming company's stock price.
Expert Solution
Step 1
We have to find when both stock prices are equal and interval on which tech company's price is higher.

Trending now
This is a popular solution!

Step by step
Solved in 2 steps with 3 images

Follow-up Questions
Read through expert solutions to related follow-up questions below.
Follow-up Question
Determine the intervals over which the tech company's stock price is higher than the streaming company's stock price
Solution
Recommended textbooks for you
Algebra and Trigonometry (MindTap Course List)
Algebra
ISBN:
9781305071742
Author:
James Stewart, Lothar Redlin, Saleem Watson
Publisher:
Cengage Learning

College Algebra
Algebra
ISBN:
9781305115545
Author:
James Stewart, Lothar Redlin, Saleem Watson
Publisher:
Cengage Learning
Algebra and Trigonometry (MindTap Course List)
Algebra
ISBN:
9781305071742
Author:
James Stewart, Lothar Redlin, Saleem Watson
Publisher:
Cengage Learning
College Algebra
Algebra
ISBN:
9781305115545
Author:
James Stewart, Lothar Redlin, Saleem Watson
Publisher:
Cengage Learning