Problem 3-10 (Algo) After plotting demand for four perlods, an emergency room manager has concluded that a trend-adjusted exponentlal smoothing model is approprlate to predict future demand. The Initlal estimate of trend Is based on the net change of 19 for the three perlods from 1 to 4, for an average of +6.33 units. Period Actual Period Actual 1 210 6. 259 229 274 224 284 229 289 5. 249 10 Click here for the Excel Data File Use a=0.40 and B=0.05, and TAF of 245 for perlod 5. Obtaln forecasts for perlods 6 through 10. (Round your Intermedlate calculations and final answers to 2 decimal places.)
Problem 3-10 (Algo) After plotting demand for four perlods, an emergency room manager has concluded that a trend-adjusted exponentlal smoothing model is approprlate to predict future demand. The Initlal estimate of trend Is based on the net change of 19 for the three perlods from 1 to 4, for an average of +6.33 units. Period Actual Period Actual 1 210 6. 259 229 274 224 284 229 289 5. 249 10 Click here for the Excel Data File Use a=0.40 and B=0.05, and TAF of 245 for perlod 5. Obtaln forecasts for perlods 6 through 10. (Round your Intermedlate calculations and final answers to 2 decimal places.)

College Algebra
7th Edition
ISBN:9781305115545
Author:James Stewart, Lothar Redlin, Saleem Watson
Publisher:James Stewart, Lothar Redlin, Saleem Watson
Chapter1: Equations And Graphs
Section: Chapter Questions
Problem 10T: Olympic Pole Vault The graph in Figure 7 indicates that in recent years the winning Olympic men’s...

Related questions
Question
100%
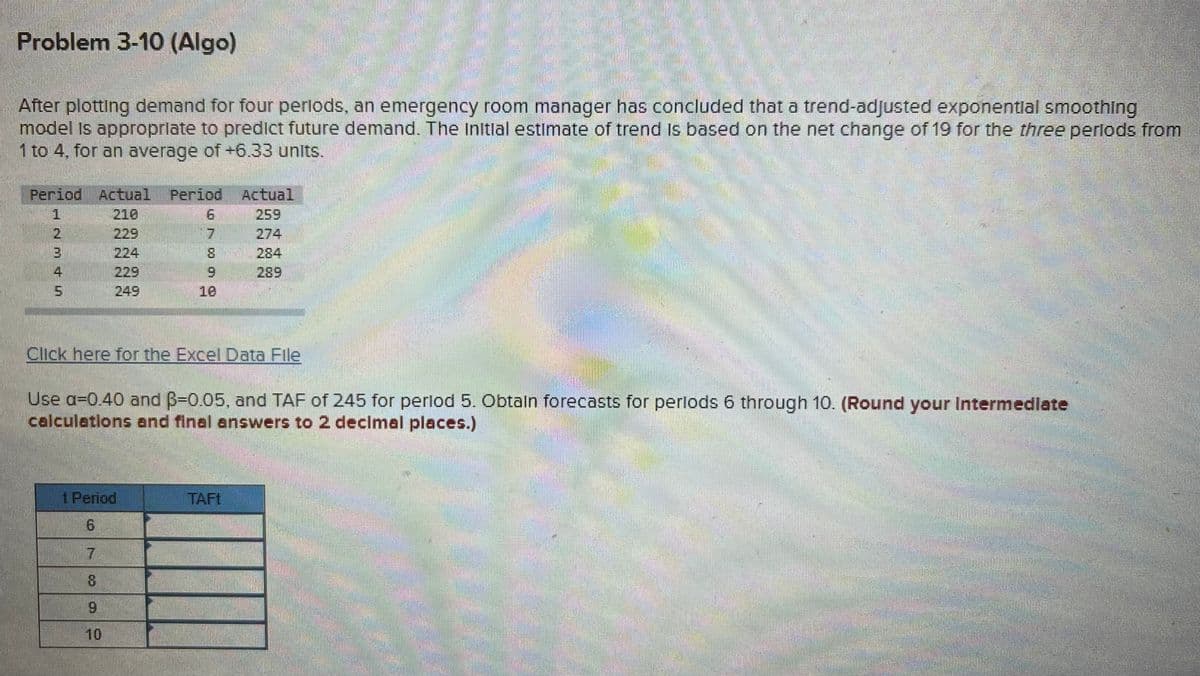
Transcribed Image Text:Problem 3-10 (Algo)
After plotting demand for four perlods, an emergency room manager has concluded that a trend-adjusted exponentlal smoothing
model Is approprlate to predict future demand. The Initlal estimate of trend Is based on the net change of 19 for the three pertods from
1 to 4, for an average of +6.33 unlts.
Actual
259
274
284
289
Period Actual
Period
210
229
7.
224
8.
6.
4
229
249
10
Click here for the Excel Data File
Use a=0.40 and B-0.05, and TAF of 245 for perlod 5. Obtaln forecasts for perlods 6 through 10. (Round your Intermedilate
calculetions end final answers to 2 decimal places.)
t Perjod
TAFT
7.
8.
10
Expert Solution
This question has been solved!
Explore an expertly crafted, step-by-step solution for a thorough understanding of key concepts.

This is a popular solution!

Trending now
This is a popular solution!

Step by step
Solved in 4 steps with 1 images

Recommended textbooks for you
College Algebra
Algebra
ISBN:
9781305115545
Author:
James Stewart, Lothar Redlin, Saleem Watson
Publisher:
Cengage Learning
College Algebra
Algebra
ISBN:
9781305115545
Author:
James Stewart, Lothar Redlin, Saleem Watson
Publisher:
Cengage Learning