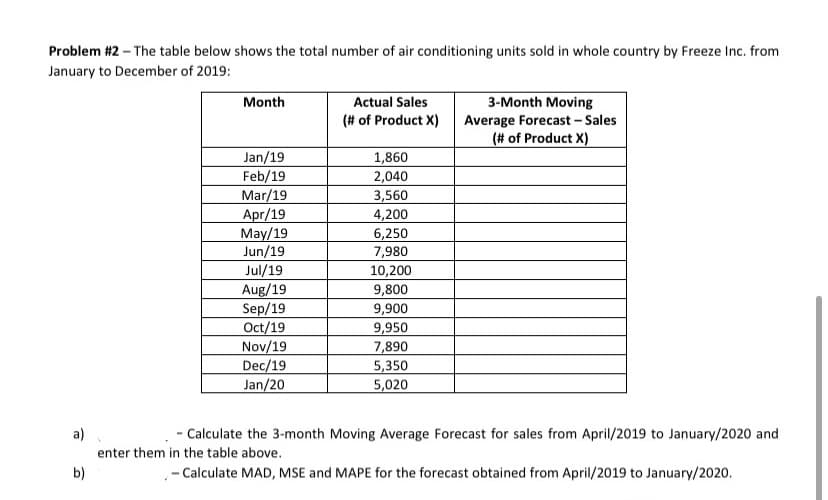
Problem #2 – The table below shows the total number of air conditioning units sold in whole country by Freeze Inc. from January to December of 2019: Month Actual Sales 3-Month Moving Average Forecast - Sales (# of Product X) (# of Product X) Jan/19 Feb/19 Mar/19 Apr/19 May/19 Jun/19 Jul/19 1,860 2,040 3,560 4,200 6,250 7,980 10,200 Aug/19 Sep/19 Oct/19 Nov/19 Dec/19 Jan/20 9,800 9,900 9,950 7,890 5,350 5,020 a) - Calculate the 3-month Moving Average Forecast for sales from April/2019 to January/2020 and enter them in the table above. b) - Calculate MAD, MSE and MAPE for the forecast obtained from April/2019 to January/2020.
Problem #2 – The table below shows the total number of air conditioning units sold in whole country by Freeze Inc. from January to December of 2019: Month Actual Sales 3-Month Moving Average Forecast - Sales (# of Product X) (# of Product X) Jan/19 Feb/19 Mar/19 Apr/19 May/19 Jun/19 Jul/19 1,860 2,040 3,560 4,200 6,250 7,980 10,200 Aug/19 Sep/19 Oct/19 Nov/19 Dec/19 Jan/20 9,800 9,900 9,950 7,890 5,350 5,020 a) - Calculate the 3-month Moving Average Forecast for sales from April/2019 to January/2020 and enter them in the table above. b) - Calculate MAD, MSE and MAPE for the forecast obtained from April/2019 to January/2020.

Algebra for College Students
10th Edition
ISBN:9781285195780
Author:Jerome E. Kaufmann, Karen L. Schwitters
Publisher:Jerome E. Kaufmann, Karen L. Schwitters
Chapter13: Conic Sections
Section13.5: Systems Involving Nonlinear Equations
Problem 41PS

Related questions
Question
help please
Transcribed Image Text:Problem #2 – The table below shows the total number of air conditioning units sold in whole country by Freeze Inc. from
January to December of 2019:
3-Month Moving
Average Forecast- Sales
(# of Product X)
Month
Actual Sales
(# of Product X)
Jan/19
Feb/19
1,860
Mar/19
Apr/19
May/19
Jun/19
Jul/19
Aug/19
Sep/19
Oct/19
Nov/19
Dec/19
Jan/20
2,040
3,560
4,200
6,250
7,980
10,200
9,800
9,900
9,950
7,890
5,350
5,020
a)
- Calculate the 3-month Moving Average Forecast for sales from April/2019 to January/2020 and
enter them in the table above.
b)
- Calculate MAD, MSE and MAPE for the forecast obtained from April/2019 to January/2020.
Expert Solution
This question has been solved!
Explore an expertly crafted, step-by-step solution for a thorough understanding of key concepts.

Step by step
Solved in 2 steps with 1 images

Recommended textbooks for you
Algebra for College Students
Algebra
ISBN:
9781285195780
Author:
Jerome E. Kaufmann, Karen L. Schwitters
Publisher:
Cengage Learning
Algebra for College Students
Algebra
ISBN:
9781285195780
Author:
Jerome E. Kaufmann, Karen L. Schwitters
Publisher:
Cengage Learning