Determine the mean profit per store. ( rou

Glencoe Algebra 1, Student Edition, 9780079039897, 0079039898, 2018
18th Edition
ISBN:9780079039897
Author:Carter
Publisher:Carter
Chapter10: Statistics
Section10.4: Distributions Of Data
Problem 19PFA

Related questions
Question
5
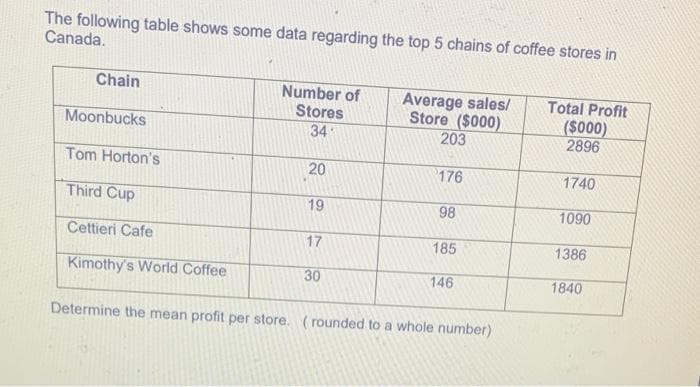
Transcribed Image Text:The following table shows some data regarding the top 5 chains of coffee stores in
Canada.
Chain
Number of
Stores
34
Average sales/
Store ($000)
203
Total Profit
($000)
2896
Moonbucks
Tom Horton's
20
176
1740
Third Cup
19
98
1090
Cettieri Cafe
17
185
1386
Kimothy's World Coffee
30
146
1840
Determine the mean profit per store. ( rounded to a whole number)
Expert Solution
This question has been solved!
Explore an expertly crafted, step-by-step solution for a thorough understanding of key concepts.

Step by step
Solved in 2 steps

Recommended textbooks for you
Glencoe Algebra 1, Student Edition, 9780079039897…
Algebra
ISBN:
9780079039897
Author:
Carter
Publisher:
McGraw Hill
Glencoe Algebra 1, Student Edition, 9780079039897…
Algebra
ISBN:
9780079039897
Author:
Carter
Publisher:
McGraw Hill