Determine whether the graph shown could represent a variable with a normal distribution. Explain your reasoning. If the graph appears to represent a normal distribution, estimate the mean and standard deviation. 20 23 26 29 32 35 38 41 44 Select the correct choice below and, if necessary, fill in the answer boxes to complete your choice. O A. The graph could not represent a variable with a normal distribution because the curve crosses the x-axis. O B. The graph could represent a variable with a normal distribution because the curve is symmetric and bell-shaped. Its mean is approximately standard deviation is approximately and its (Round to one decimal place as needed.) O C. The graph could not represent a variable with a normal distribution because the graph is skewed to the right. O D. The graph could not represent a variable with a normal distribution because the curve is constant. O E. The graph could not represent a variable with a normal distribution because the graph is skewed to the left. O F. The graph could not represent a variable with a normal distribution because the curve has two modes. Incorrec
Determine whether the graph shown could represent a variable with a normal distribution. Explain your reasoning. If the graph appears to represent a normal distribution, estimate the mean and standard deviation. 20 23 26 29 32 35 38 41 44 Select the correct choice below and, if necessary, fill in the answer boxes to complete your choice. O A. The graph could not represent a variable with a normal distribution because the curve crosses the x-axis. O B. The graph could represent a variable with a normal distribution because the curve is symmetric and bell-shaped. Its mean is approximately standard deviation is approximately and its (Round to one decimal place as needed.) O C. The graph could not represent a variable with a normal distribution because the graph is skewed to the right. O D. The graph could not represent a variable with a normal distribution because the curve is constant. O E. The graph could not represent a variable with a normal distribution because the graph is skewed to the left. O F. The graph could not represent a variable with a normal distribution because the curve has two modes. Incorrec

Glencoe Algebra 1, Student Edition, 9780079039897, 0079039898, 2018
18th Edition
ISBN:9780079039897
Author:Carter
Publisher:Carter
Chapter10: Statistics
Section10.4: Distributions Of Data
Problem 22PFA

Related questions
Question
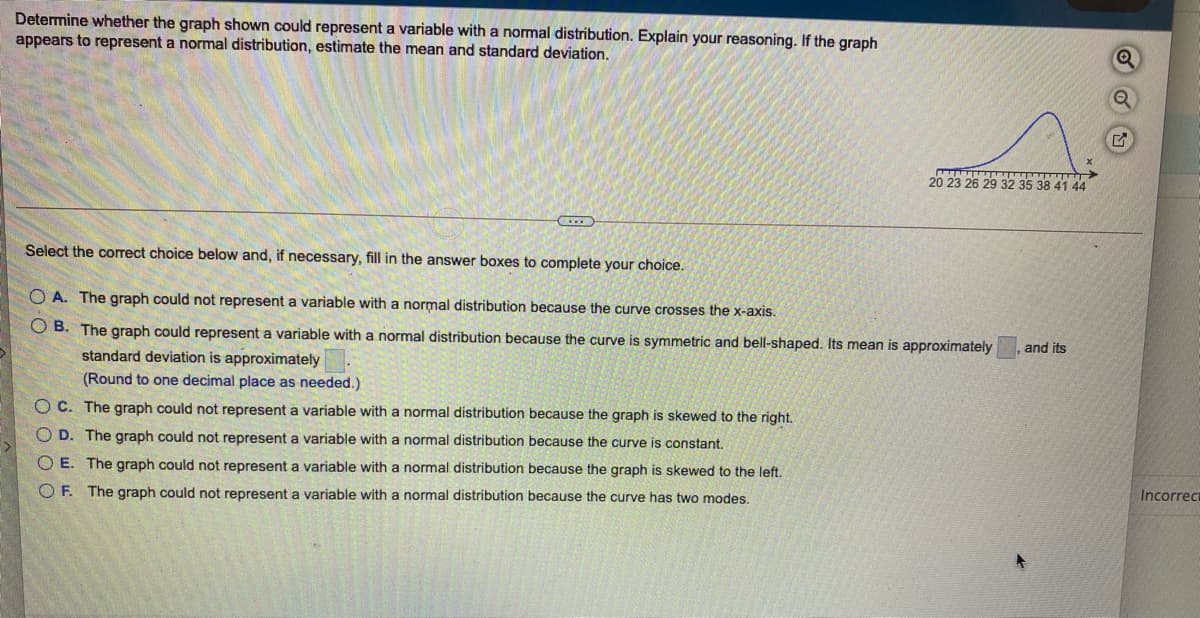
Transcribed Image Text:Determine whether the graph shown could represent a variable with a normal distribution. Explain your reasoning. If the graph
appears to represent a normal distribution, estimate the mean and standard deviation.
20 23 26 29 32 35 38 41 44
Select the correct choice below and, if necessary, fill in the answer boxes to complete your choice.
O A. The graph could not represent a variable with a normal distribution because the curve crosses the x-axis.
O B. The graph could represent a variable with a normal distribution because the curve is symmetric and bell-shaped. Its mean is approximately
and its
standard deviation is approximately
(Round to one decimal place as needed.)
O C. The graph could not represent a variable with a normal distribution because the graph is skewed to the right.
O D. The graph could not represent a variable with a normal distribution because the curve is constant.
O E. The graph could not represent a variable with a normal distribution because the graph is skewed to the left.
O F. The graph could not represent a variable with a normal distribution because the curve has two modes.
Incorrec
Expert Solution
Step 1

Trending now
This is a popular solution!

Step by step
Solved in 2 steps with 2 images

Recommended textbooks for you
Glencoe Algebra 1, Student Edition, 9780079039897…
Algebra
ISBN:
9780079039897
Author:
Carter
Publisher:
McGraw Hill

Big Ideas Math A Bridge To Success Algebra 1: Stu…
Algebra
ISBN:
9781680331141
Author:
HOUGHTON MIFFLIN HARCOURT
Publisher:
Houghton Mifflin Harcourt
Glencoe Algebra 1, Student Edition, 9780079039897…
Algebra
ISBN:
9780079039897
Author:
Carter
Publisher:
McGraw Hill
Big Ideas Math A Bridge To Success Algebra 1: Stu…
Algebra
ISBN:
9781680331141
Author:
HOUGHTON MIFFLIN HARCOURT
Publisher:
Houghton Mifflin Harcourt