Determine whether the scatter diagram indicates that a linear relation may exist between the two variables. If the relation is linear, determine whether it indicates a positive or negative association between the variables. Use this information to answer the following. 30- 20- 10- 40 Explanatory Do the two variables have a linear relationship? O A. The data points do not have a linear relationship because they lie mainly in a straight line. O B. The data points have a linear relationship because they do not lie mainly in a straight line. OC. The data points have a linear relationship because they lie mainly in a straight line. OD. The data points do not have a linear relationship because they do not lie mainly in a straight line. Do the two variables have a positive or a negative association? O A. The two variables have a negative association. O B. The two variables have a positive association. O C. None of the above
Determine whether the scatter diagram indicates that a linear relation may exist between the two variables. If the relation is linear, determine whether it indicates a positive or negative association between the variables. Use this information to answer the following. 30- 20- 10- 40 Explanatory Do the two variables have a linear relationship? O A. The data points do not have a linear relationship because they lie mainly in a straight line. O B. The data points have a linear relationship because they do not lie mainly in a straight line. OC. The data points have a linear relationship because they lie mainly in a straight line. OD. The data points do not have a linear relationship because they do not lie mainly in a straight line. Do the two variables have a positive or a negative association? O A. The two variables have a negative association. O B. The two variables have a positive association. O C. None of the above

Functions and Change: A Modeling Approach to College Algebra (MindTap Course List)
6th Edition
ISBN:9781337111348
Author:Bruce Crauder, Benny Evans, Alan Noell
Publisher:Bruce Crauder, Benny Evans, Alan Noell
Chapter2: Graphical And Tabular Analysis
Section2.3: Solving Linear Equations
Problem 11E: Supply and Demand The quantity S of barley, in billions of bushels, that barley suppliers in a...

Related questions
Question
12
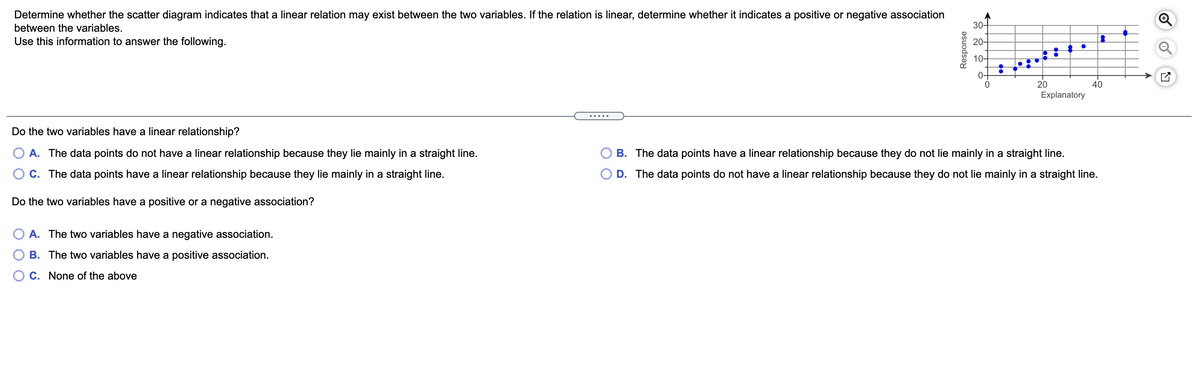
Transcribed Image Text:Determine whether the scatter diagram indicates that a linear relation may exist between the two variables. If the relation is linear, determine whether it indicates a positive or negative association
between the variables.
30-
Use this information to answer the following.
20-
10-
0-
20
40
Explanatory
Do the two variables have a linear relationship?
O A. The data points do not have a linear relationship because they lie mainly in a straight line.
B. The data points have a linear relationship because they do not lie mainly in a straight line.
C. The data points have a linear relationship because they lie mainly in a straight line.
D. The data points do not have a linear relationship because they do not lie mainly in a straight line.
Do the two variables have a positive or a negative association?
O A. The two variables have a negative association.
B. The two variables have a positive association.
O C. None of the above
Expert Solution
This question has been solved!
Explore an expertly crafted, step-by-step solution for a thorough understanding of key concepts.

This is a popular solution!

Trending now
This is a popular solution!

Step by step
Solved in 2 steps

Recommended textbooks for you
Functions and Change: A Modeling Approach to Coll…
Algebra
ISBN:
9781337111348
Author:
Bruce Crauder, Benny Evans, Alan Noell
Publisher:
Cengage Learning

Algebra & Trigonometry with Analytic Geometry
Algebra
ISBN:
9781133382119
Author:
Swokowski
Publisher:
Cengage

Algebra: Structure And Method, Book 1
Algebra
ISBN:
9780395977224
Author:
Richard G. Brown, Mary P. Dolciani, Robert H. Sorgenfrey, William L. Cole
Publisher:
McDougal Littell
Functions and Change: A Modeling Approach to Coll…
Algebra
ISBN:
9781337111348
Author:
Bruce Crauder, Benny Evans, Alan Noell
Publisher:
Cengage Learning
Algebra & Trigonometry with Analytic Geometry
Algebra
ISBN:
9781133382119
Author:
Swokowski
Publisher:
Cengage
Algebra: Structure And Method, Book 1
Algebra
ISBN:
9780395977224
Author:
Richard G. Brown, Mary P. Dolciani, Robert H. Sorgenfrey, William L. Cole
Publisher:
McDougal Littell

Glencoe Algebra 1, Student Edition, 9780079039897…
Algebra
ISBN:
9780079039897
Author:
Carter
Publisher:
McGraw Hill

Holt Mcdougal Larson Pre-algebra: Student Edition…
Algebra
ISBN:
9780547587776
Author:
HOLT MCDOUGAL
Publisher:
HOLT MCDOUGAL