Determine whether the scatter diagram indicates that a linear relation may exist between the two variables. If the relation is linear, determine whether it indicates a positive or negative association between the variables. Use this information to answer the following. 30 Q 20- 10 26 Explanatory 40 Do the two variables have a linear relationship? O A. The data points have a linear relationship because they do not lie mainly in a straight line. The data points have a linear relationship because they lie mainly in a straight line. OC. The data points do not have a linear relationship because they lie mainly in a straight line. D. The data points do not have a linear relationship because they do not lie mainly in a straight line. Do the two variables have a positive or a negative association? O A. The two variables have a negative association. O B. The two variables have a positive association. O C. None of the above Response
Determine whether the scatter diagram indicates that a linear relation may exist between the two variables. If the relation is linear, determine whether it indicates a positive or negative association between the variables. Use this information to answer the following. 30 Q 20- 10 26 Explanatory 40 Do the two variables have a linear relationship? O A. The data points have a linear relationship because they do not lie mainly in a straight line. The data points have a linear relationship because they lie mainly in a straight line. OC. The data points do not have a linear relationship because they lie mainly in a straight line. D. The data points do not have a linear relationship because they do not lie mainly in a straight line. Do the two variables have a positive or a negative association? O A. The two variables have a negative association. O B. The two variables have a positive association. O C. None of the above Response

Chapter3: Polynomial Functions
Section3.5: Mathematical Modeling And Variation
Problem 1ECP: The ordered pairs below give the median sales prices y (in thousands of dollars) of new homes sold...

Related questions

Concept explainers
Contingency Table
A contingency table can be defined as the visual representation of the relationship between two or more categorical variables that can be evaluated and registered. It is a categorical version of the scatterplot, which is used to investigate the linear relationship between two variables. A contingency table is indeed a type of frequency distribution table that displays two variables at the same time.
Binomial Distribution
Binomial is an algebraic expression of the sum or the difference of two terms. Before knowing about binomial distribution, we must know about the binomial theorem.
Topic Video
Question
Solve the 2nd question please
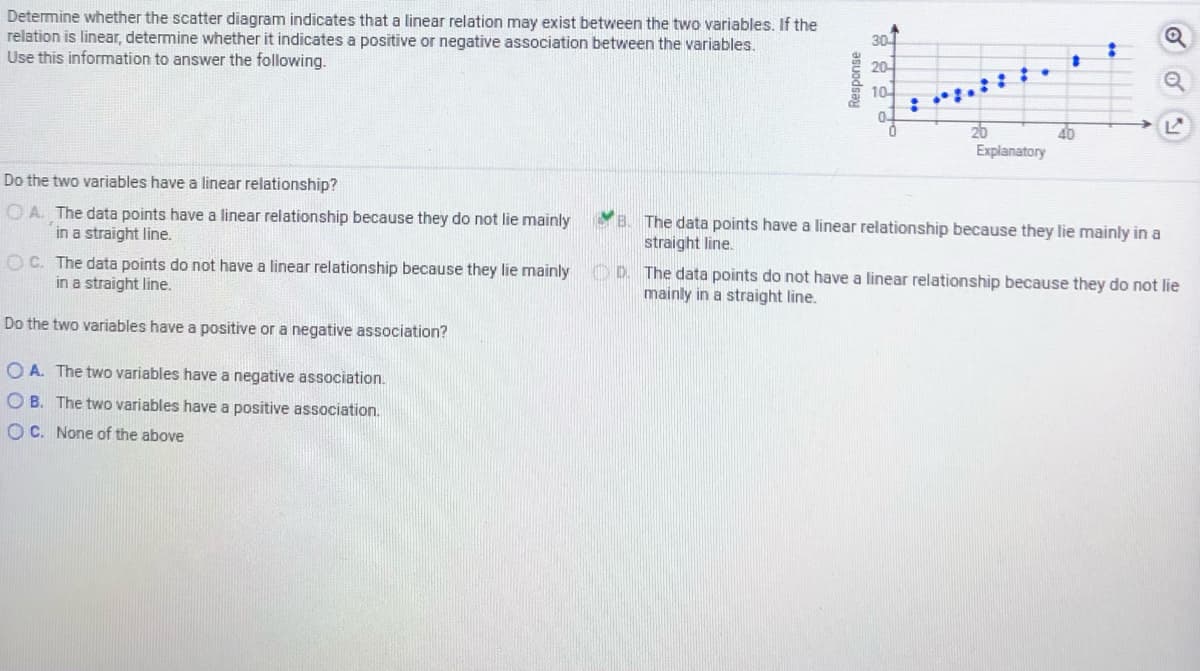
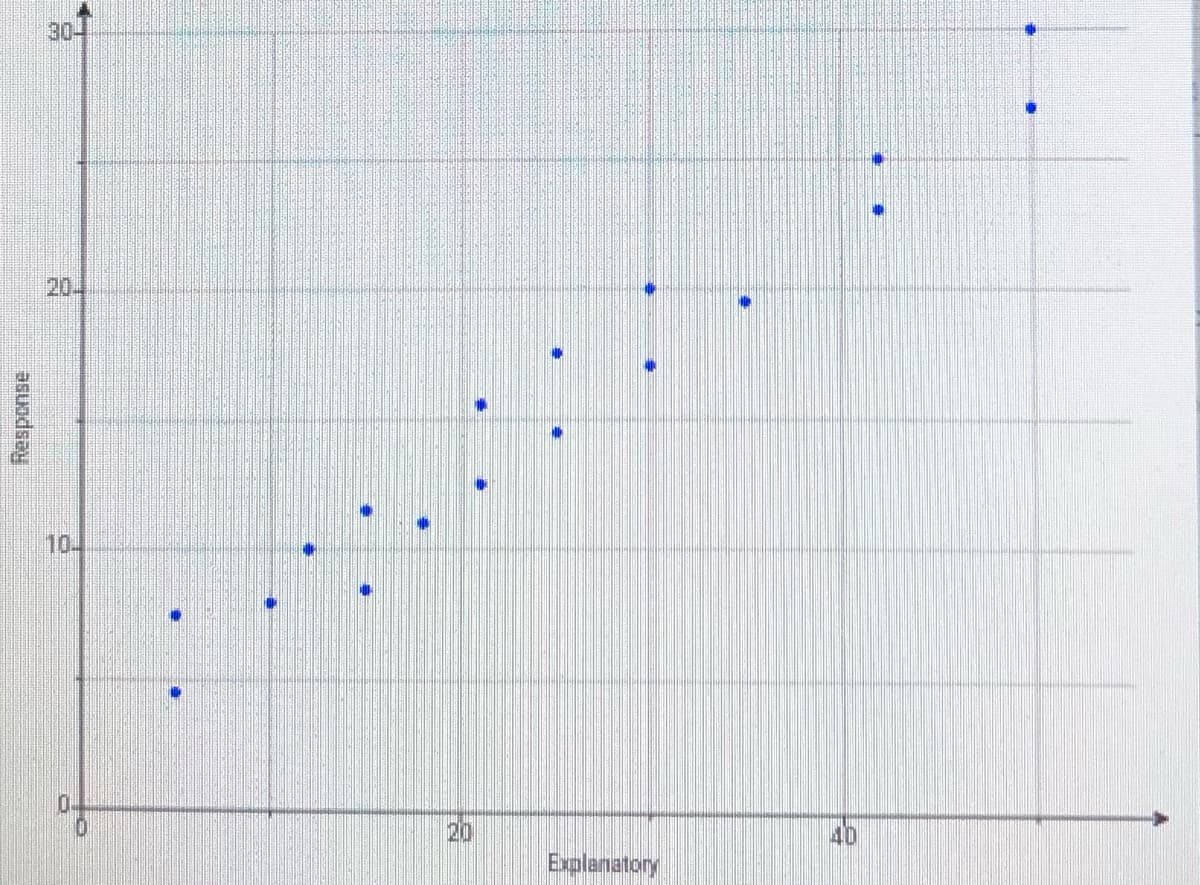
Transcribed Image Text:Determine whether the scatter diagram indicates that a linear relation may exist between the two variables. If the
relation is linear, determine whether it indicates a positive or negative association between the variables.
Use this information to answer the following.
20-
10
26
Explanatory
40
Do the two variables have a linear relationship?
OA The data points have a linear relationship because they do not lie mainly
in a straight line.
B. The data points have a linear relationship because they lie mainly in a
straight line.
OC. The data points do not have a linear relationship because they lie mainly OD. The data points do not have a linear relationship because they do not lie
in a straight line.
mainly in a straight line.
Do the two variables have a positive or a negative association?
O A. The two variables have a negative association.
O B. The two variables have a positive association.
O C. None of the above
Transcribed Image Text:304
20
10-
20
Explanatory
Response
Expert Solution
This question has been solved!
Explore an expertly crafted, step-by-step solution for a thorough understanding of key concepts.

Step by step
Solved in 2 steps with 1 images

Knowledge Booster


Learn more about
Need a deep-dive on the concept behind this application? Look no further. Learn more about this topic, statistics and related others by exploring similar questions and additional content below.Recommended textbooks for you

Algebra & Trigonometry with Analytic Geometry
Algebra
ISBN:
9781133382119
Author:
Swokowski
Publisher:
Cengage

Algebra: Structure And Method, Book 1
Algebra
ISBN:
9780395977224
Author:
Richard G. Brown, Mary P. Dolciani, Robert H. Sorgenfrey, William L. Cole
Publisher:
McDougal Littell
Algebra & Trigonometry with Analytic Geometry
Algebra
ISBN:
9781133382119
Author:
Swokowski
Publisher:
Cengage
Algebra: Structure And Method, Book 1
Algebra
ISBN:
9780395977224
Author:
Richard G. Brown, Mary P. Dolciani, Robert H. Sorgenfrey, William L. Cole
Publisher:
McDougal Littell

Glencoe Algebra 1, Student Edition, 9780079039897…
Algebra
ISBN:
9780079039897
Author:
Carter
Publisher:
McGraw Hill

Holt Mcdougal Larson Pre-algebra: Student Edition…
Algebra
ISBN:
9780547587776
Author:
HOLT MCDOUGAL
Publisher:
HOLT MCDOUGAL