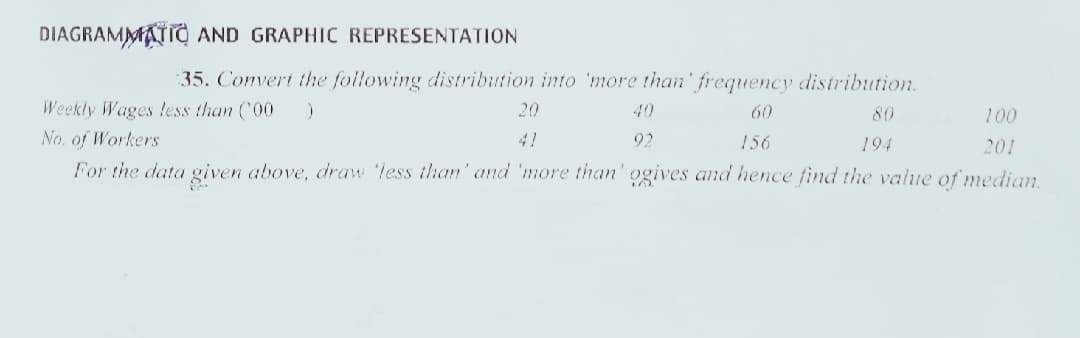
DIAGRAMMATIO AND GRAPHIC REPRESENTATION 35. Convert the following distribution into 'more than' frequency distribution. Weekly Wages less than (00 No. of Workers 20 40 60 80 100 41 92 156 194 201 For the data given above, draw 'less than' and 'more than' ogives and hence find the vale of median.
DIAGRAMMATIO AND GRAPHIC REPRESENTATION 35. Convert the following distribution into 'more than' frequency distribution. Weekly Wages less than (00 No. of Workers 20 40 60 80 100 41 92 156 194 201 For the data given above, draw 'less than' and 'more than' ogives and hence find the vale of median.

Big Ideas Math A Bridge To Success Algebra 1: Student Edition 2015
1st Edition
ISBN:9781680331141
Author:HOUGHTON MIFFLIN HARCOURT
Publisher:HOUGHTON MIFFLIN HARCOURT
Chapter11: Data Analysis And Displays
Section: Chapter Questions
Problem 11CR

Related questions
Question
Transcribed Image Text:DIAGRAMMATIO AND GRAPHIC REPRESENTATION
35. Convert the following distribution into 'more than' frequency distribution.
Weekly Wages !ess than (00
No. of Workers
20
40
60
80
100
41
92
156
194
201
For the data given above, draw 'less than' and 'more than' ogives and hence find the valuIe of median.
Expert Solution
This question has been solved!
Explore an expertly crafted, step-by-step solution for a thorough understanding of key concepts.

Step by step
Solved in 2 steps with 1 images

Recommended textbooks for you
Big Ideas Math A Bridge To Success Algebra 1: Stu…
Algebra
ISBN:
9781680331141
Author:
HOUGHTON MIFFLIN HARCOURT
Publisher:
Houghton Mifflin Harcourt
Big Ideas Math A Bridge To Success Algebra 1: Stu…
Algebra
ISBN:
9781680331141
Author:
HOUGHTON MIFFLIN HARCOURT
Publisher:
Houghton Mifflin Harcourt