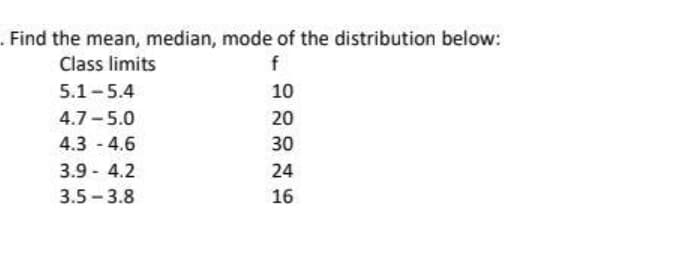
ind the mean, median, mode of the distribution below: Class limits 5.1-5.4 10 4.7-5.0 20 4.3 - 4.6 30 3.9 - 4.2 24 3.5 - 3.8 16


Q: What’s is the mean for 5,8,6,2,7,2,3,7,4 Rounded to tenths place Median: Mo
A: Given values are 5, 8, 6, 2, 7, 2, 3, 7, 4. Mean: Mean=sum of valuesnumber of values…
Q: Vhat is the mean (or average) for the following distribution of scores? 7. 10 12 9.0 O 8.5 O 11.0 O…
A: Data 7,7,9,10,12 We want to find the mean Mean=(sum of all observation )/number of observation…
Q: Draw stem and leaf display of the following value. Find mean, median, mode and range, mid- range of…
A: Stem and leaf display: Stem Leaf 0 2 1 0 2 3 4 2 1 7 7 8 9 3 4 6 5 6 7 6 0 0 0…
Q: Find the three measures of central tendency (the mean, median, and mode). (If an answer does not…
A: Solution: The given data is 0, 1, 1, 2, 3, 4, 11 and 34.
Q: 4, 4, 5, 6, 9, 9, 9, 12, 13, 14, 14 26. The mean is 27 The median of the distribution is 28. The…
A: Solution: Given data is already in ascending order so use given data n=number of elements=11…
Q: The number of credits being taken by a sample of 13 full-time college students are listed below.…
A:
Q: Find the mean median and mode of the five scores
A: Obtain the value of mean. The value of mean is obtained below as follows: Use EXCEL Procedure…
Q: a) List the data in a stem and leaf diagram b) Find the median c) Find the first and third quartiles
A: Note : as per policy I have calculated 3 SUBPARTS PLZ REPOST FOR REMAINING Here ascending order of…
Q: Find the mean, median, and mode for the following sample of scores: 9, 6, 7, 10, 7, 9, 9, 7 9, 4, 9,…
A: Mean : The mean is the average of the data set. Formula for mean, x = ∑xin Median: The median is the…
Q: 1a. The distribution of the mark scored by three candidate in a professional examination are 54, 24,…
A: 1a. Given The data is as follows: 54, 24, 36
Q: For the distribution shown, which letter represents the median? A BC (This is a reading assessment…
A: Solution: The distribution graph is given.
Q: Based on the histogram below, how are data distributed, and where is the mean located in relation to…
A: We have to find out the shape of the distribution and determine whether mean is right or left to…
Q: The boxplots below represent movie run-times (length of a movie in minutes) for movies that have…
A: Solution Four box plot are given on the same scale .
Q: A small company consists of the owner, the manager, the salesperson, and two technicians, all of…
A: Generally, to find the characteristics of frequency distribution there are several methods. Among…
Q: A. Find the mean, median, mode, Q,, Qs, D,, Pa, and P7 of each of the following data sets. Make a…
A: We will answer the first three subparts of this question as per our guideline. Please resubmit the…
Q: The frequency distribution lists the results of a quiz. Find the mean, median, and mode of the…
A: The data of score is, Score Number of student 10 3 9 10 8 9 7 8 6…
Q: Inter-State Moving and Storage Company wishes to establish a control chart to monitor the proportion…
A:
Q: a) Find the number of customers in this sample who had waist sizes from 30-36 inches. b) Is this…
A:
Q: Find the value of a and b What is the largest value in the dataset? What the is median of the…
A: Disclaimer : “Since you have posted a question with multiple sub-parts, we will solve first three…
Q: Abena Debrah,hair dresser,deposited her weekly sale with Takoradi branch of Agricultural Development…
A: Since you have posted a question with multiple sub-parts, we will solve first three subparts for…
Q: 3. Find the mean, median, and mode for the following sample of scores: 3, 6, 7, 3, 9, 8, 3, 7, 5…
A:
Q: Which is an example of a discrete distribution? O weight of football players O speed of an airplane…
A: Option 3) is correct. Number of vending machine on campus
Q: What is the value of the median?
A: From the above stem and leaf plot, data set is obtained as follows; 23, 23 , 24 , 24 , 24 , 26 , 26…
Q: Class 366-386 387 - 407 408 - 428 429 - 449 450 - 470 471 - 491 492 512 513 - 533 Frequency 5 2…
A: Solution-: We have following frequency distribution table: Class Freq (fi) 366-386 5 387-407…
Q: Use the given graph to find mean, median, and mode of the distribution
A:
Q: A small warehouse employs a supervisor at $1350 a week, an inventory manager at $770 a week, six…
A: Note: Since you have posted questions with multiple subparts, we will solve the first three…
Q: 1. In 2017 the state University's men's basketball team finished the season 15 out of 78 men's…
A: Given information: Men's basketball team finished the season 15 out of 78 men's teamsWomen's…
Q: Use technology to calculate the mean, median and mode for the following data sets. Points scored by…
A:
Q: d the mean, median mode and sample skewness for X = 5, 10,15,20,2
A: The mean is calculated as: The mean is 15. A data set can have multiple modes. If all the data…
Q: The ten fastest times in a city marathon are below. Find the mean, median, and mode of this set.…
A: Given Data: Time set: {2 hr 46 min ; 3 hr 7 min ; 3 hr 32 min ; 3 hr 33 min ; 3 hr 46 min ; 3 hr 54…
Q: Determine the distribution of the data pictured below data O Bell-shaped and symmetric O…
A: In question, We have given a picture of box plot. Then we'll find it's shape. The solution is…
Q: 1. The total areas, in thousands of square miles, of the 15 largest states in the United States are…
A: Hi! Thank you for the question As per the honor code, We’ll answer the first question since the…
Q: CB A or the distribution drawn here, identify the mecan, median, and mode. A) A = median, B = mode,…
A: The mean (average) of a data set is found by adding all numbers in the data set and then dividing by…
Q: Find the mean, median, and mode for the sample whose observations, 15, 3, 95, 19, 12, 8, 22, and 14,…
A: Hello! As you have posted 2 different questions, we are answering the first question. In case you…
Q: Consider the distribution of scores of 15 students: 83, 72, 87, 79, 75, 82, 76, 77, 73, 86, 81, 79,…
A: Arrange the given data in ascending order72,73,74,75,76,77,79,79,79,81,82,82,83,86,87sample…
Q: n employee kept track of the number of times she downloaded files to her work computer over the last…
A: Given that From the table To find the which measures are correct
Q: Q2- A) find the value of the Geometric Mean and the Arithmetic Mean to the following values: y; =…
A: Q2-A). Find the values of the geometric mean and arithmetic mean: The geometric mean of the given…
Q: Mean = 64.57 median = 64.50 mode = 64.09 comment on the shape of the distribution. Give reasons…
A: Given that Mean = 64.57 median = 64.50 mode = 64.09
Q: are 32.1 and 35.4 respectively. Find out the value of median. Example 8. In a moderately…
A: Givenin a asymmetrical distributionMode=32.1Mean=35.4
Q: mean median and mode for the score in the following frequency distribution tabl
A:
Q: are are iChi-square distribution table Degrees of Freedom 0.995 0.99 0.975
A: Level of significancce = 0.01 Human activity Natural patterns Don't know Total Male 315 172…
Q: I need help filling in the following blanks based on the attached table: The median frequency of…
A: Med= Size or value of n+12th observation in the data array.Quartiles: The values of observations in…
Q: are 32.1 and 35.4 respectively. Find out the value of median. Example 8. In a moderately…
A: From the provided information, Mode = 32.1 Mean = 35.4
Q: Find the mean, the median, and the mode for the set of scores in the frequency distribution table.…
A:
Q: The grades on the second statistics test for Ms. Rose's class are in the following list. Complete…
A: A graphical representation is the geometric image of a set of data. Graphs give a better picture…
Q: A park ranger wants to know the mean number of nights students in your school plan to camp next…
A: Given: A park ranger wants to know the mean number of nights students in your school pan to camp…
Q: create a sampling distribution of your data. get the mean, variance, and standard deviation. data:…
A:
Q: Inter-State Moving and Storage Company wishes to establish a control chart to monitor the proportion…
A: In question, We have given number of complaints in 12 months. Then, we'll find the mean proportion,…

Step by step
Solved in 3 steps with 2 images
