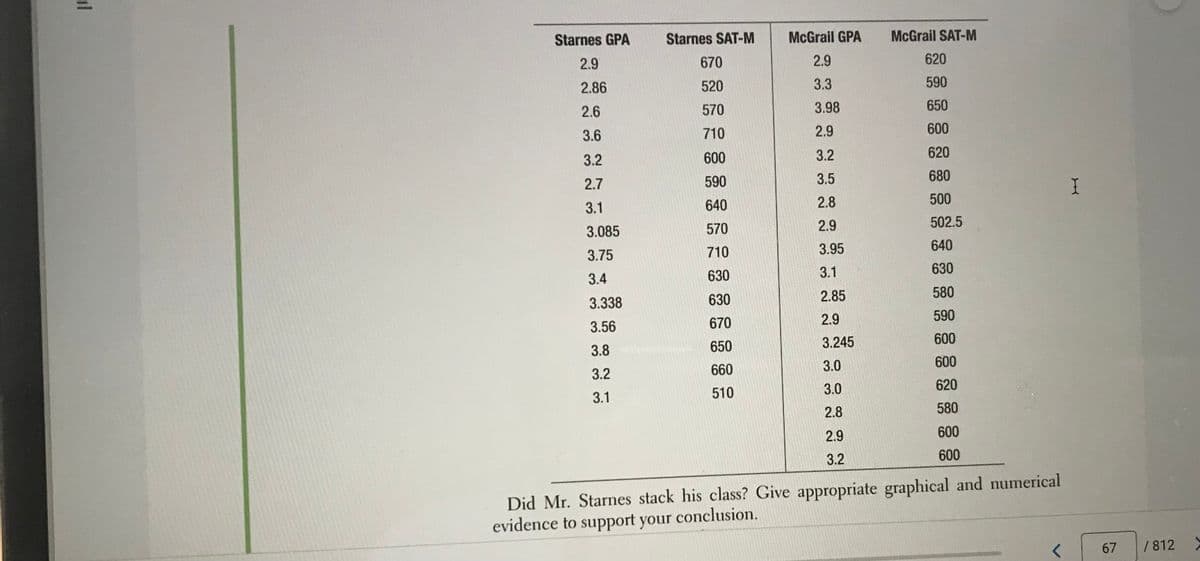
Did Mr. Starnes stack his class? Give appropriate graphical and numerical widence to support your conclusion.


Q: Using the given result/data, create a discussion with backup related literature.
A: The given data is a Likert scale analysis which analysis the responses of the customers regarding…
Q: What are the hypotheses and conclusion of the Mean Value Theorem? What physical interpretations…
A:
Q: At the 5% significance level, is there evidence that the body weight of the athlete is a useful…
A: The slope is given by The standard error is given by
Q: Find the average squared in classified data xi fi 7 8 6 9 11 7 12 17 7 21 8 24 9
A: The formula of average for grouped data is: x=1∑i=1nfi∑i=1nxifi Here, n=8.
Q: Do you think that a margin of error greater than 5% is appropriate when conducting a research?
A: Margin of error helps to understand the confidence level of the research or survey. It is calculated…
Q: What is the graphical interpretation of the IVT?
A: The intermediate value theorem, IVT states that a continuous function f (x) within a closed interval…
Q: Bonferroni adjustments are necessary when making multiple comparisons because they keep the Type I…
A: Bonferroni adjustment is used to maintain the same alpha level by decreasing the critical value for…
Q: Step 5: There sufficient evidence to conclude that
A: Given : x1= 68.0 n1= 240 x2= 43.0 n2= 151 significance level, 0.01
Q: What is the average number of customer service by Spa C?
A:
Q: is also called as the 'Average of the first order'. О а. Меan O b. Variability O C. Median O d. Mode
A: We have to find correct answer for given data..
Q: Given the image below, what can be determined about the z-score associated with the shaded area?
A: We have to identify the z score for given area inder Standard Normal curve.
Q: An article in the Archives of Internal Medicine reported that in a sample of 244 men, 73had elevated…
A:
Q: Explain how is BEDMAS used and its right order.
A: The right order of BEDMAS is described below.
Q: Define the term linear interpolation?
A:
Q: Question is describe a type II error
A: In a study of smokers, 39 are smoking after one year and 32 are not smoking after the treatment; the…
Q: Describe about ESTIMATING EFFECT SIZE in AONVA.
A: Effect size measurements in ANOVA are measures of the degree of correlation between the effect…
Q: What is A Basic Deficiency for point estimate?
A: Point estimate: Point estimate is the singles value for the population parameter, which is obtained…
Q: . Refers to any measurable quantity calculated from the sample.
A: A statistic Refers to any measurable quantity calculated from the sample.
Q: Is this value from a discrete or continuous data set. The amount of water used by a household during…
A: We want to tell you which one is the correct choice.
Q: When do we add the two corresponding areas of the z-score
A: A Z-score is a numerical measurement that describes a value's relationship to the mean of a group of…
Q: Select all the appropriate names for Type I error. | false negative | consumer's risk | false…
A: False positive is the appropriate name for type 1 error.
Q: The production of four machines in an enterprise is as follows. Since the data is normally…
A: There are 4 independent samples which are A, B, C and D. We have to test whether there is a…
Q: The Insurance Institute for Highway Saftey publishes data on the total damage suffered by compact…
A:
Q: A data set has a first quartile of 42 and a third quartile of 50. Compute the lower andupper limits…
A:
Q: List one general strength of using nonparametric tests?
A: Nonparametric tests are used when there is no type of distribution given and a relationship or…
Q: In the real world, what are some examples of data sources that, even with large sample sizes, will…
A: The Central Limit Theorem says that when the mean of the samples are taken then it is approximately…
Q: The central limit theorem is vital in statistics for two main reasons—the normality assumption and…
A: The central limit theorem states that the sampling distribution of any distribution, if you do it so…
Q: Why is the Central Limit Theorem important to understand as a concept in sample means distributions
A: Central limit theorem: If a random sample of size n is taken from a population having mean µ and…
Q: Explain the Critical Z score.
A:
Q: Assume critical reading scores for a standardized test are distributed as N(580, 100). Complete…
A: Given that The test scores are normally distributed. Mean (μ) = 580 Standard deviation (σ) = 100 We…
Q: What is the average number of times a drawing must be examined by a client before it is accepted?
A: The average or expected value of X is defined as E(X) = Σx.P(X = x)
Q: the numerical value that is the best measure of central tendency for the "jobwant" varialbe is ____.…
A:
Q: Compute the interquartile range for the following scores that represent a continuous variable: 1, 2,…
A:
Q: Give a general description of the nature of and relationship between Type I and Type II errors.
A: Here we want to know relationship between type I and type II error.
Q: what is the formula for finding the inter quartile range
A: Quartiles:Three Quartiles,The first quartile separates the lowest 25% of the observations from the…
Q: Do most analysts still insist on at least interval level of measurement as a condition for the use…
A: We need to use the concept of Measurement scales and the Parametric tests
Q: Estimate the difference using benchmarks.
A: Using benchmark we approximate the value.
Q: Assume that you have a large set of data that ranges from a low score of 209 to a high score of 283.…
A: 15. The best width of class interval is, Width=High score-Low scoreNumber of…
Q: Describe the differences between symmetrical and asymmetrical measures of association.
A: We have to describe the differwnces between symmetrical and asymmetrical measure of association.
Q: Define Type I and Type II error with example?
A: To define Type I error and Type II error.
Q: Insurance Institute for Highway Safety publishes data on the total damage suffered by compact…
A:
Q: What are composite areas?
A:
Q: A car wash is assessing the average wait time for its customers. The median wait time is 4 minutes.…
A: When we talk about median , it is the middle number in a sorted, ascending or descending, list of…
Q: When taking a sample for research we need to be mindful of the Central Limit Theorem which assumes…
A: Central limit theorem : The central limit theorem tells , exactly what the shape of the…
Q: Bonferroni adjustments are necessary when making multiple comparisons to avoid inflating the Type I…
A: when conducting multiple analyses on the same dependent variable, there may be a chance of…
Q: How is dfwithin and dftotal calculated in statistics? Please write out words for formulas.
A: Given that
Q: What is the maximum number of dummy variables that can be defined when a qualitative variable has 4…
A: When we have m categories of the variable then we define (m - 1) dummy variables.
Q: There (is/is not) enough evidence at the ___% level of significance to (support/ Reject) the claim…
A: Here, the null hypothesis is rejected.
Q: State the Mean Value Theorem and give a geometricinterpretation.
A:
Please use the data plot to show the contract between two teachers' data.


Trending now
This is a popular solution!

Step by step
Solved in 4 steps with 4 images

- Date DJIA S&P 500 January 6 12,360 1,278 January 13 12,422 1,289 January 20 12,720 1,315 January 27 12,660 1,316 February 3 12,862 1,345 February 10 12,801 1,343 February 17 12,950 1,362 February 24 12,983 1,366 March 2 12,978 1,370 March 9 12,922 1,371 March 16 13,233 1,404 March 23 13,081 1,397 March 30 13,212 1,408 April 5 13,060 1,398 April 13 12,850 1,370Sale Price 9950 6536 11554 10049 11542 9339 11022 9858 6863 10912 12028 7661 10783 8959 6602 10123 10234 7104 8970 8490 9682 8208 9496 8352 12003 12260 12824 9733 10592 12232 13010 11725 6700 13104 11166 12684 12293 8152 7110 11255 8361 11550 9871 6634 11298 7594 6258 9413 10991 9304Rank Player Money ($) Scoring Average DrDist DrAccu GIR 1 Vijay Singh 6,601,094 70.27 297.8 59.45 68.45 2 Phil Mickelson 5,188,875 70.28 295.7 55.27 65.81 3 Sergio Garcia 4,858,224 70.6 294.6 59.39 67.06 4 Kenny Perry 4,663,794 70.21 296 61.97 67.47 5 Anthony Kim 4,656,265 70.22 300.9 58.34 65.78 6 Camilo Villegas 4,422,641 70.6 293.3 58.15 64.6 7 Padraig Harrington 4,313,551 70.7 296.3 59.37 60.67 8 Stewart Cink 3,979,301 70.65 296.9 55.27 66.94 9 Justin Leonard 3,943,542 70.41 281.4 67.72 66.61 10 Robert Allenby 3,606,700 70.64 291.7 65.64 70.4 11 Jim Furyk 3,455,714 70.56 280.4 69.37 66.78 12 Ryuji Imada 3,029,363 71.13 278.6 59.64 61.39 13 Mike Weir 3,020,135 70.68 284.8 62.46 64.62 14 Geoff Ogilvy 2,880,099 71.38 292.1 58.18 61.89 15 K.J. Choi 2,683,442 71.01 286.1 61.38 65.48 16 Ben Curtis 2,615,798 70.96 284.7 67.2 63.45 17 Kevin Sutherland 2,581,311 70.22 291 61.93 68.2 18 Trevor Immelman 2,566,199 71.85 291.3 62.45 63.07 19 Ernie Els…
- Online Trailer Views (millions) Opening Weekend Box Office Gross ($millions) Online Trailer Views (millions) Opening Weekend Box Office Gross ($millions) 58.485 31.963 3.169 1.611 10.539 2.563 32.824 63.843 7.290 6.615 4.267 13.376 11.117 20.214 42.382 86.251 83.747 102.996 4.989 4.690 32.036 60.081 6.630 33.377 21.858 19.098 0.942 3.705 6.362 9.752 2.258 1.513 1.984 9.872 11.327 18.470 47.499 35.661 8.966 12.202 5.433 21.575 15.177 4.357 27.396 18.002 13.714 30.436 2.141 2.859 31.231 53.003 57.337 150.198 52.612 46.607 7.918 11.225 16.235 13.003 8.372 6.775 6.884 3.776 9.117 0.427 11.698 18.223 1.888 5.706 2.827 3.471 2.883 3.998 23.075…68 Sample data:0.7100.7400.6400.3900.7002.2001.9800.6401.2200.2001.6401.3302.9500.9001.7601.0101.2600.0000.6501.4601.6201.8300.9901.5600.4101.2800.8301.3400.5401.2500.9201.0000.7800.7901.4401.0002.2402.5001.7901.2501.4900.8401.4201.0001.2501.4201.3500.9300.4001.390Sample Took_course Did_not_take_course1 95 922 78 673 65 474 84 765 69 536 74 617 76 648 71 569 90 8510 96 9411 67 5012 93 8913 75 6214 99 9815 94 9116 79 6817 73 5918 91 8619 72 5820 89 83
- Sample;Took_course;Did_not_take_course1;95;922;78;673;65;474;84;765;69;536;74;617;76;648;71;569;90;8510;96;9411;67;5012;93;8913;75;6214;99;9815;94;9116;79;6817;73;5918;91;8619;72;5820;89;83NORTH–SOUTH AIRLINE CASENorthern Airline DataAirframe CostEngine CostAverage AgeYearper Aircraftper Aircraft(Hours)200151.8043.496,512200254.9238.588,404200369.7051.4811,077200468.9058.7211,717200563.7245.4713,2752006 84.7350.2615,215200778.7479.6018,390Southeast Airline DataAirframe CostEngine CostAverage AgeYearPer Aircraftper Aircraft(Hours)200113.2918.865,107200225.1531.558,145200332.1840.437,360200431.7822.105,773200525.3419.697,150200632.7832.589,364200735.5638.078,2591. Develop Regression equations for each cost category as dependent variables and average age as independent variables. Do this for each Airline. Look at graphs produced by QM2. From the regression results, what would you conclude about a) airframe vs engine costs for each airlineb) comparing airlines as to airframe costsc) comparing airlines as to engine costsd) Provide a brief summary report of your comparisonsAdams County, Nebraska 33,024 31,126 31,181 31,299 31,367 31,396 Antelope County, Nebraska 6,729 6,742 6,697 6,655 6,600 6,531 Arthur County, Nebraska 364 426 448 490 507 476 Banner County, Nebraska 824 720 703 778 816 788 Blaine County, Nebraska 471 539 585 584 586 594 Boone County, Nebraska 5,531 5,553 5,512 5,473 5,441 5,404 Box Butte County, Nebraska 11,031 11,372 11,383 11,345 11,312 11,308 Boyd County, Nebraska 2,120 2,107 2,095 2,025 2,093 2,067 Brown County, Nebraska 3,178 3,192 3,153 3,183 3,167 3,090 Buffalo County, Nebraska 44,877 45,437 45,842 46,330 46,885 47,388 Burt County, Nebraska 7,047 6,964 6,901 6,829 6,748 6,690 Butler County, Nebraska 8,416 8,382 8,360 8,345 8,334 8,312 Cass County, Nebraska 25,495 25,246 25,230 25,214 25,222 25,315 Cedar County, Nebraska 8,582 8,906 8,839 8,807 8,790 8,736 Chase County, Nebraska 3,702 3,927 3,937 3,964 3,984 3,990 Cherry County, Nebraska 5,682 5,783 5,750 5,722 5,735 5,749 Cheyenne County, Nebraska…
- Sale Price 12400 10400 12100 10000 11000 8895 7675 9975 6350 10470 9895 11250 8795 12500 9340 10150 9200 9395 11000 10640 10000 7500 8000 10440 10200 10300 9740 9280 10930 8000 9000 7680 9400 10730 7350 12240 11970 8240 9910 10080 9440 8970 9500 10050 10130 11400 8500 7500 9090 10500 According to the National Automobile Dealers Association, the mean price for used cars is $10,192. A manager of a Kansas City used car dealership reviewed a sample of 50 recent used car sales at the dealership in an attempt to determine whether the population mean price for used cars at this particular dealership differed from the national mean. The prices for the sample of 50 cars are shown in the file named UsedCars. Formulate the hypotheses that can be used to determine whether a difference exists in the mean price for used cars at the dealership. What is the p-value? At , what is your conclusion?Company Competitor 1383 1153 2022 1067 2429 1296 901 1406 2219 1254 1896 1335 1910 1204 1539 1076 2048 1246 2881 1098 2395 1258 1349 955 2052 954 2675 1363 1588 1022 2704 1155 3148 1807 2822 1295 2217 1116 2260 1323 3040 1326 3137 1107 2977 1163 2599 1254 2412 1017 3187 938 2598 1270 2995 1042 3046 1318 3858 1497 2438 750 3243 1380 2764 1053 2944 932 3324 1097 2797 1193 3914 1271 2766 843 2273 780 3052 1095 3202 1290 3672 937 3957 1390 3274 1056 3788 1235 3502 1235 2942 999 3078 1066 3196 641 3141 1322 3579 1289 3895 1060 above is the excel data, please solve the excel part with formulas and explanation, thanksZIP Code Population Season Pass Holders 45220 14171 224 45219 17576 42 45225 13437 15 45217 5731 78 45214 9952 19 45232 6913 28 45223 13349 83 45229 15713 75 45206 11353 69 45202 15105 83 45203 3411 9 45207 8233 8 41074 5566 36 41073 6193 63 45224 21043 207 41071 21596 133 45205 21683 102 45204 6642 36 41016 5603 42 45216 9028 55 45212 22356 207 41011 25849 193 41014 7913 41 45237 21137 86 45208 18236 424 45211 33968 342 45239 26485 269 41075 15868 236 45209 8941 111 45226 5029 84 45238 42737 564 45231 39939 361 45213 11683 153 45215 28915 308 45218 3917 54 41017 40218 493 41076 14779 176 45251 22887 205 45227 18431 215 45247 20372 357 41015 22298 189 45248 22880 380 45236 21823 310 45240 27033 142 45246 13522 100 45230 25763 423 45233 14175 244 45252 4799 58 41018 29001 244 45243 14755 303 45241 25623 299 45014 44178 307 45242 20015 377 45244 26316 448 41059 2266 22 41048…


