DIRECTION: Datermine the following quantity using the table on the scores of students in chemistry Scores 30-39 40-49 50-59 3 60-69 10 70-79 19 80-89 5 90-99 4 Complete the Frequency Distribution Table 6) interval 8) cumulative frequency for Q 10) Ib for Q 12) for for Q₁ AN Lottan! 1 2 7) N 9) cumulative frequency for Q 11) Ib for as 13) for for Qz 15) 부
DIRECTION: Datermine the following quantity using the table on the scores of students in chemistry Scores 30-39 40-49 50-59 3 60-69 10 70-79 19 80-89 5 90-99 4 Complete the Frequency Distribution Table 6) interval 8) cumulative frequency for Q 10) Ib for Q 12) for for Q₁ AN Lottan! 1 2 7) N 9) cumulative frequency for Q 11) Ib for as 13) for for Qz 15) 부

Glencoe Algebra 1, Student Edition, 9780079039897, 0079039898, 2018
18th Edition
ISBN:9780079039897
Author:Carter
Publisher:Carter
Chapter10: Statistics
Section: Chapter Questions
Problem 27SGR

Related questions
Question
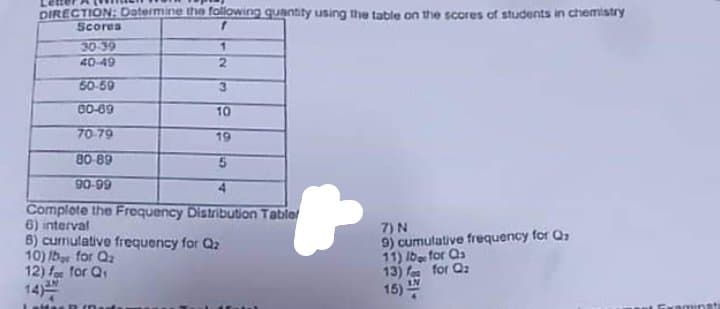
Transcribed Image Text:DIRECTION: Datermine the following quantity using the table on the scores of students in chemistry
f
Scores
30-39
40-49
50-59
3
60-69
10
70-79
19
80-89
5
90-99
4
Complete the Frequency Distribution Table
6) interval
8) cumulative frequency for Q
10) Ib for Qa
12) for for Q₁
AN
Letter E
1
2
7) N
9) cumulative frequency for Q₂
11) Ib for as
13) fo
for Qz
15) 부
Expert Solution
This question has been solved!
Explore an expertly crafted, step-by-step solution for a thorough understanding of key concepts.

Step by step
Solved in 4 steps with 4 images

Recommended textbooks for you
Glencoe Algebra 1, Student Edition, 9780079039897…
Algebra
ISBN:
9780079039897
Author:
Carter
Publisher:
McGraw Hill

Algebra & Trigonometry with Analytic Geometry
Algebra
ISBN:
9781133382119
Author:
Swokowski
Publisher:
Cengage
Glencoe Algebra 1, Student Edition, 9780079039897…
Algebra
ISBN:
9780079039897
Author:
Carter
Publisher:
McGraw Hill
Algebra & Trigonometry with Analytic Geometry
Algebra
ISBN:
9781133382119
Author:
Swokowski
Publisher:
Cengage