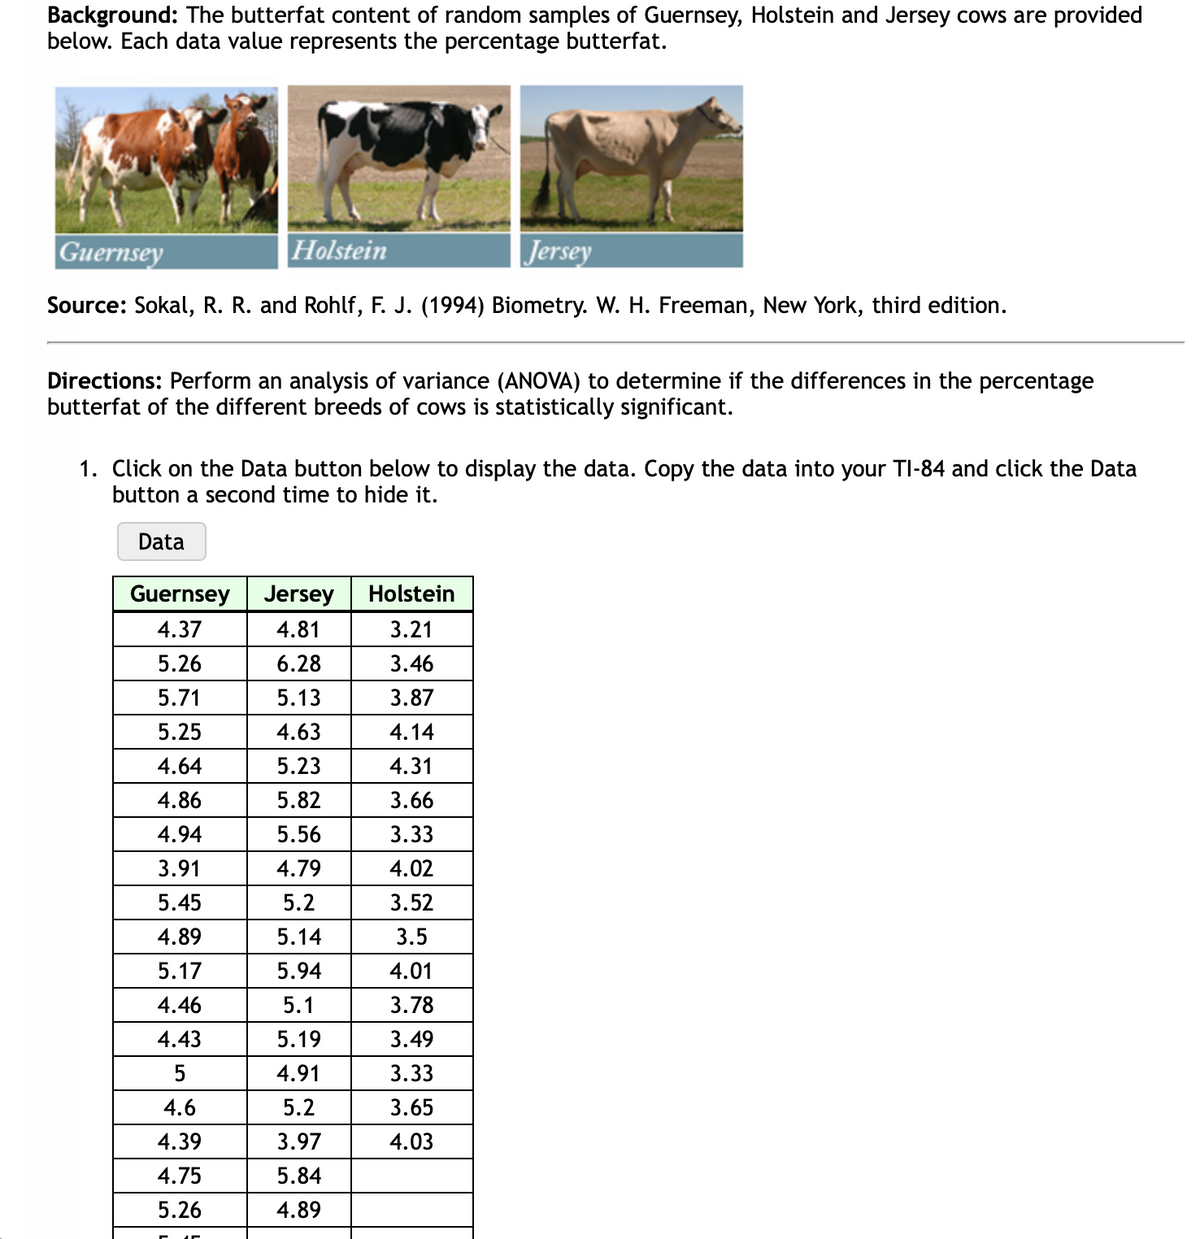
Directions: Perform an analysis of variance (ANOVA) to determine if the differences in the percentage butterfat of the different breeds of cows is statistically significant. 1. Click on the Data button below to display the data. Copy the data into your TI-84 and click the Data button a second time to hide it. Data Guernsey Jersey Holstein 4.37 4.81 3.21 5.26 6.28 3.46 5.71 5.13 3.87 5.25 4.63 4.14 4.64 5.23 4.31 4.86 5.82 3.66 4.94 5.56 3.33 3.91 4.79 4.02 5.45 5.2 3.52 4.89 5.14 3.5 5.17 5.94 4.01 4.46 5.1 3.78 4.43 5.19 3.49 4.91 3.33 4.6 5.2 3.65 4.39 3.97 4.03 4.75 5.84 4 80

Glencoe Algebra 1, Student Edition, 9780079039897, 0079039898, 2018
18th Edition
ISBN:9780079039897
Author:Carter
Publisher:Carter
Chapter10: Statistics
Section: Chapter Questions
Problem 19SGR
icon
Related questions
icon
Concept explainers
Topic Video
Question
Background: The butterfat content of random samples of Guernsey, Holstein and Jersey cows are provided
below. Each data value represents the percentage butterfat.
Guernsey
Holstein
Jersey
Source: Sokal, R. R. and Rohlf, F. J. (1994) Biometry. W. H. Freeman, New York, third edition.
Directions: Perform an analysis of variance (ANOVA) to determine if the differences in the percentage
butterfat of the different breeds of cows is statistically significant.
1. Click on the Data button below to display the data. Copy the data into your TI-84 and click the Data
button a second time to hide it.
Data
Guernsey
Jersey
Holstein
4.37
4.81
3.21
5.26
6.28
3.46
5.71
5.13
3.87
5.25
4.63
4.14
4.64
5.23
4.31
4.86
5.82
3.66
4.94
5.56
3.33
3.91
4.79
4.02
5.45
5.2
3.52
4.89
5.14
3.5
5.17
5.94
4.01
4.46
5.1
3.78
4.43
5.19
3.49
4.91
3.33
4.6
5.2
3.65
4.39
3.97
4.03
4.75
5.84
5.26
4.89
Transcribed Image Text:Background: The butterfat content of random samples of Guernsey, Holstein and Jersey cows are provided below. Each data value represents the percentage butterfat. Guernsey Holstein Jersey Source: Sokal, R. R. and Rohlf, F. J. (1994) Biometry. W. H. Freeman, New York, third edition. Directions: Perform an analysis of variance (ANOVA) to determine if the differences in the percentage butterfat of the different breeds of cows is statistically significant. 1. Click on the Data button below to display the data. Copy the data into your TI-84 and click the Data button a second time to hide it. Data Guernsey Jersey Holstein 4.37 4.81 3.21 5.26 6.28 3.46 5.71 5.13 3.87 5.25 4.63 4.14 4.64 5.23 4.31 4.86 5.82 3.66 4.94 5.56 3.33 3.91 4.79 4.02 5.45 5.2 3.52 4.89 5.14 3.5 5.17 5.94 4.01 4.46 5.1 3.78 4.43 5.19 3.49 4.91 3.33 4.6 5.2 3.65 4.39 3.97 4.03 4.75 5.84 5.26 4.89
5
4.91
3.33
4.6
5.2
3.65
4.39
3.97
4.03
4.75
5.84
5.26
4.89
5.45
6.21
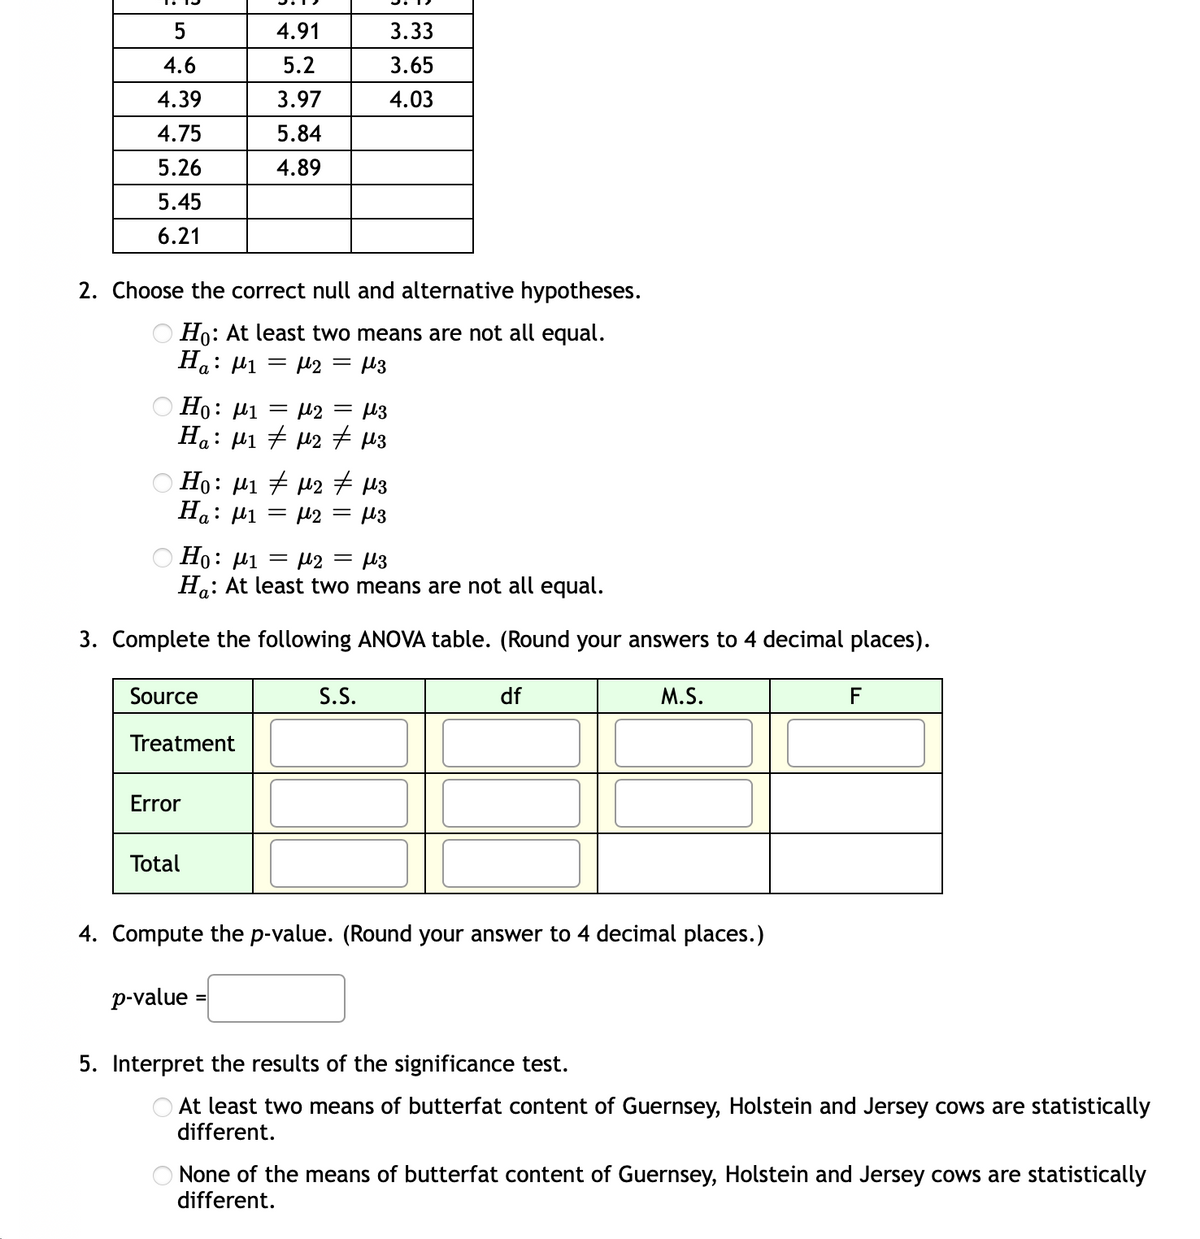
2. Choose the correct null and alternative hypotheses.
OHo: At least two means are not all equal.
Ha: H1 = 42 = µ3
Ho: µ1 = H2 = M3
Ha: µ1 + u2 7 u3
Ho: µi + µ2 + u3
Ha: H1
= µ2 = µ3
Ho: µi = µ2 = l3
Ha: At least two means are not all equal.
3. Complete the following ANOVA table. (Round your answers to 4 decimal places).
Source
S.S.
df
M.S.
F
Treatment
Error
Total
4. Compute the p-value. (Round your answer to 4 decimal places.)
p-value
5. Interpret the results of the significance test.
At least two means of butterfat content of Guernsey, Holstein and Jersey cows are statistically
different.
None of the means of butterfat content of Guernsey, Holstein and Jersey cows are statistically
different.
Transcribed Image Text:5 4.91 3.33 4.6 5.2 3.65 4.39 3.97 4.03 4.75 5.84 5.26 4.89 5.45 6.21 2. Choose the correct null and alternative hypotheses. OHo: At least two means are not all equal. Ha: H1 = 42 = µ3 Ho: µ1 = H2 = M3 Ha: µ1 + u2 7 u3 Ho: µi + µ2 + u3 Ha: H1 = µ2 = µ3 Ho: µi = µ2 = l3 Ha: At least two means are not all equal. 3. Complete the following ANOVA table. (Round your answers to 4 decimal places). Source S.S. df M.S. F Treatment Error Total 4. Compute the p-value. (Round your answer to 4 decimal places.) p-value 5. Interpret the results of the significance test. At least two means of butterfat content of Guernsey, Holstein and Jersey cows are statistically different. None of the means of butterfat content of Guernsey, Holstein and Jersey cows are statistically different.
Expert Solution
trending now

Trending now

This is a popular solution!

steps

Step by step

Solved in 2 steps with 4 images

Blurred answer
Knowledge Booster
Centre, Spread, and Shape of a Distribution
Learn more about
Need a deep-dive on the concept behind this application? Look no further. Learn more about this topic, statistics and related others by exploring similar questions and additional content below.
Recommended textbooks for you
Glencoe Algebra 1, Student Edition, 9780079039897…
Algebra
ISBN:
9780079039897
Author:
Carter
Publisher:
McGraw Hill
College Algebra (MindTap Course List)
Algebra
ISBN:
9781305652231
Author:
R. David Gustafson, Jeff Hughes
Publisher:
Cengage Learning