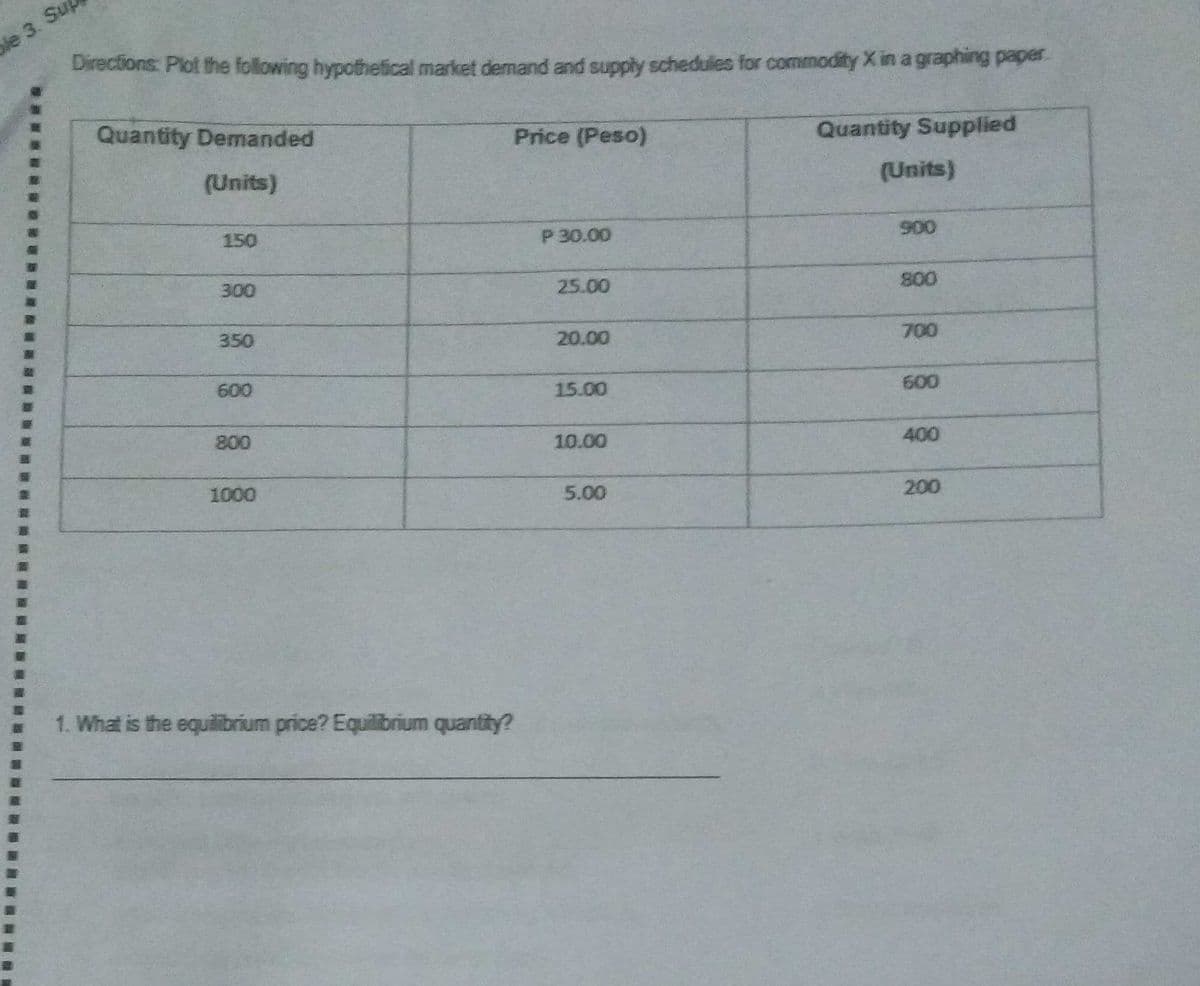
Directions: Plot the following hypothefical market demand and supply schedules for commodity X in a graphing paper Quantity Demanded Price (Peso) Quantity Supplied (Units) (Units) 900 150 P 30.00 25.00 800 300 700 350 20.00 600 15.00 600 400 800 10.00 1000 5.00 200 1. What is the equilibrium price? Equilibrium quantity?


Q: List the basic trend patterns within the projection methods and determine which is the most commonly…
A: Demand: Request is a monetary guideline alluding to a shopper's craving to buy labor and products…
Q: Question 2 Using diagrams, analyze which changes in price and quantity would be expected under the…
A: Demand Curve: - demand curve is the graphical way of showing the relationship between the quantity…
Q: Draw an aggregate demand and supply diagram for Japan. In the diagram, show how each of the…
A: “Since you have posted a question with multiple sub-parts, we will solve first three sub-parts for…
Q: For each “Market Change” there is a Demand column and a Supply Column. In each of those two columns,…
A: Market Change Demand Supply Minimum wage rises Decreases Increases why? Implications of Raising…
Q: In Korea, real GDP per hour of labor is $22, the real wage rate is $15 per hour, and people work…
A: Korean marketThe given information:Real GDP per hour of labor is $22The real wage rate is $15 per…
Q: The absolute prices of goods X, Y, and Z, respectively, are $23, $42, & $56. (a) What is the…
A: Definition A relative price is defined as the price of a good or a commodity in terms of another…
Q: Question 6 refers to the graph below. Aggregate Supply1 Aggregate Supply2 Aggregate Supply3…
A: Aggregate demand (AD) curve is a downward sloping curve indicating a negative relationship between…
Q: Suppose that in normal years demand is represented by Case 2, and supply is represented by Case B.…
A: PLEASE FIND THE ANSWER BELOW.
Q: Consider the market for product ABC, when the price is at Php 12, quantity demanded is 6…
A: We are going to find demand and supply function to solve all questions provided.
Q: The accompanying table provides data regarding domestic demand and domestic supply of apples in the…
A: [a] CS = consumer surplus PS = producer surplus the red line indicates the demand graph blue line…
Q: Use supply and demand graphs to illustrate the increase and subsequent decrease of lumber prices…
A: Suppose the market for lumber is in equilibrium as shown below, the equilibrium is maintained at…
Q: Diagram SDI DO DO Quantity Quantity Quantity Quantity Graph A Graph B Graph C Graph D Refer to…
A: The supply curve shifts if there is a change in the components of supply except for a change in…
Q: Consider the market for product ABC, when the price is at Php 12, quantity demanded is 6 units and…
A:
Q: The following data are taken from a United States Department of Agriculture (USDA) report for the…
A: Market: It refers to a place where goods and services are available. The market sells goods and…
Q: Holiday Assignment 1. me reaning of Equilibrum price and price determination. - making use of…
A: "Since you have posted multiple questions, we will solve the first question for you. If you want any…
Q: All of the leather that this question refers to was produced in the US by the X Company in 2017.…
A: Final Goods: It refers to those goods which are either used for consumption or investment…
Q: ilk in the US economy will maintain equilibrium over time given the problem that will exist with…
A: Supply is the amount of a good which could be provided to the market, while demand is the amount of…
Q: Answer the following questions on the basis of the following three sets of data for the country of…
A:
Q: Commodities include raw materials, minerals and foodstuffs. In the 1970s the price of one commodity,…
A: Since you have posted a question with multiple sub-parts, we will solve first three sub-parts for…
Q: AS Price Level 100 105 103 AD Real GDP 10t 20t 30t Considering the figure above, at what point does…
A: There are two types of aggregate supply prevailing in the market based on the time period under…
Q: Demand is ________ when a change in price leads to a relatively larger change in the quantity…
A: A) Elastic: Demand for a product is flexible when an adjustment of cost has a moderately great…
Q: The prices and quantities sold at the Waleska Clothing Emporium for ties, suits, and shoes for April…
A: Since we only answer up to 3 sub-parts, we’ll answer the first 3. Please resubmit the question and…
Q: If no trade occurs between the markets, what are the equilibrium values of D1, S1, P1, D2, S2, and…
A: Equilibrium is attained in the market at the point where the demand and supply are the same. At the…
Q: Answer the following questions on the basis of the following three sets of data for the country of…
A: Nominal GDP measures the output of an economy, including current prices, without any adjustments…
Q: Three main ideas help explain why the prices of some services, such as education, health care, and…
A: In the 1 condition, it is given that Real wages in different occupations must rise at similar rates…
Q: Which of the following best describes the consumer price index? O the average wage rate for a given…
A: The Consumer Price Index (CPI) is a measure of an economy's overall price level. The CPI is made up…
Q: Figure 1.1 a) A b) B c) C d) F 1.6 An increase in the population that is unemployed is best…
A: 1.7 The two major types of markets in the simple circular flow of income and expenditure are: d)…
Q: 1. In the labor market, the demand for labor represents A)The number of hours indivduals wish to…
A: Labor is the human element in the production process in an economy.
Q: Supply and Demand In a free market economy, the price of a product is determined by the relationship…
A: The law of supply and demand is a hypothesis that makes sense of the communication between the…
Q: Referring to the panels, which of the four panels represents the market for high-rise building…
A: Steel is an input required in the market for construction. Thus a rise in steel price indicates a…
Q: How do you explain the sharp decline of "Crude Oil prices"? Globally what can be the economic,…
A: Economics is a branch of social science that describes and analyzes the behaviors and decisions…
Q: After lockdowns were declared globally in 2020, the price of oil crashed from $64 per barrel in…
A: The markets for goods, and services are based upon the working of the forces of demand, and supply.…
Q: Demand Equation: QX = 30 - 2.PX Inverse Supply Equation: In an economy with PX = (QX / 2) - 5,…
A: Demand(dd) shows a negative relationship between the price(P) and the quantity demanded(QD) i.e.…
Q: Use the following information to answer questions 5 through 12: Suppose that a typical market based…
A: The consumer price index is calculated by taking the ratio of two variables namely the price basket…
Q: Directions: Plot the following hypothetical market demand and supply schedules for commodity X in a…
A: Note: We’ll answer the first question since the exact one wasn’t specified. Please submit a new…
Q: Supply and Demand: By The Numbers Total fall enrollment in degree-granting postsecondary…
A: The change in percentage can be calculated by using the following formula.
Q: Consider the market for product ABC, when the price is at Php 12, quantity demanded is 6…
A: “Since you have posted a question with multiple sub-parts, we will solve the first three sub-parts…
Q: c. Describe what will happen to the market and solve for the equilibrium price and quantity under…
A: The curve that depicts various quantities of goods and services that are being demanded and supplied…
Q: The price of a Big Mac in the United States in 2015 was $4.79. Using the Big Mac burger as a…
A: PPP adjustment factor can be calculated by using the following formula: When the US big Mac price is…
Q: The accompanying table provides data regarding domestic demand and domestic supply of apples in the…
A: Hi Student, Thanks for posting the question. As per the guideline, we are providing answer for the…
Q: How the enumerated in the table below affects the demand and supply? Describe their impact with the…
A: Movement in a curve can occur as the shift of the curve or movement along the curve. The change in…
Q: Price Level Aggregate Demand Aggregate Supply 200 10,000 4,000 300 9,000 6,000 400 8,000 8,000 500…
A: Aggregate demand refers to the entire quantity of demand for all completed goods and services…
Q: Country A raises the wage of workers. Many workers lose their jobs and move to Country B. How would…
A: Wage is the compensation a worker gets for their work. The supply of labor in inversely related to…
Q: Preamble for Questions 1-8. Consider a fish/fishing rod economy, with Crusoe and Friday the entire…
A: Y=1050 GDP = $4000 50 fishing rods created by Friday and 1000 fish caught by Crusoe. The price of…
Q: Graphically illustrate how each of the following events, ceteris paribus, will affect the market for…
A:

Step by step
Solved in 2 steps

- The 2019/20 Australia Bushfires affected food production nearly in New South Wales, Queensland and Victoria that are regarded as the food basket for Australia. Assume that before, the bushfire, in 2017/18 Australia produced 80,000 metric tons. Also, assuime that after the bushfire devastation in 2019/20 Australia produced 50,000 metric tons of rice. Finally, assume that during the same period 2017/18 and 2019/20 the price rice in Australia rose from AUD 1.75 per kg to AUD 3.00 per kg respectively. Use the Demand and Supply Model below to answer the questions that follow. Q. Use the mid-point approach to calculate the price elasticity of demand for rice in Australia.The 2019/20 Australia Bushfires affected food production nearly in New South Wales, Queensland and Victoria that are regarded as the food basket for Australia. Assume that before, the bushfire, in 2017/18 Australia produced 80,000 metric tons. Also, assuime that after the bushfire devastation in 2019/20 Australia produced 50,000 metric tons of rice. Finally, assume that during the same period 2017/18 and 2019/20 the price rice in Australia rose from AUD 1.75 per kg to AUD 3.00 per kg respectively. Explain the impact of the bushfires on the rice market in New South Wales with Demand and Supply model.The 2019/20 Australia Bushfires affected food production nearly in New South Wales, Queensland and Victoria that are regarded as the food basket for Australia. Assume that before, the bushfire, in 2017/18 Australia produced 80,000 metric tons. Also, assuime that after the bushfire devastation in 2019/20 Australia produced 50,000 metric tons of rice. Finally, assume that during the same period 2017/18 and 2019/20 the price rice in Australia rose from AUD 1.75 per kg to AUD 3.00 per kg respectively. Use the Demand and Supply Model below to answer the questions that follow. *Picture attached. 1.Use the Demand and Supply Model above to explain the impact of the bushfires on the rice market in New South Wales. 2.Use the mid-point approach to calculate the price elasticity of demand for rice in Australia. 3.What is the price elasticity of demand for rice? Based on your answer, is rice a necessity commodity? Explain your answer.
- The 2019/20 Australia Bushfires affected food production nearly in New South Wales, Queensland and Victoria that are regarded as the food basket for Australia. Assume that before, the bushfire, in 2017/18 Australia produced 80,000 metric tons. Also, assuime that after the bushfire devastation in 2019/20 Australia produced 50,000 metric tons of rice. Finally, assume that during the same period 2017/18 and 2019/20 the price rice in Australia rose from AUD 1.75 per kg to AUD 3.00 per kg respectively. 1. Use the mid-point approach to calculate the price elasticity of demand for rice in Australia. 2. What is the price elasticity of demand for rice? Based on your answer, is rice a necessity commodity? Explain your answer.Consider the market for product ABC, when the price is at Php 12, quantity demanded is 6 units and quantity supplied is 3 units. An eight pesos increase in the price would change quantity demanded by 2 units and quantity supplied by 4 units. How much is the price of product ABC when no one wants to sell the product? How much is the gap at price of Php 18? How much is the price of product ABC when no one wants to buy it? Choices: shortage ; 3.75 6decrease ; 0.25shortage ; 1.536increase ; 0.5-39 increase ; 0.25 5decrease ; 0.5 surplus ; 1.5 16surplus ; 3.75Consider the market for product ABC, when the price is at Php 12, quantity demanded is 6 units and quantity supplied is 3 units. An eight pesos increase in the price would change quantity demanded by 2 units and quantity supplied by 4 units. How much is the gap at price of Php 11? A one peso decrease in the price of the product would _ quantity demanded by _ units.How much is the equilibrium price? How many units is the quantity supplied when price is zero? Choices: shortage ; 3.75 6decrease ; 0.25shortage ; 1.536increase ; 0.5-39 increase ; 0.25 5decrease ; 0.5 surplus ; 1.5 16surplus ; 3.75
- PLEASE ANSWER A The Market for Chicken Meat in Davao Citya. Fill in the missing algebraic signs ( + or -) of the demand and supply equations for chicken meat belowaccording to the hypothesized direction of relationships. where:Q = quantity of chicken meat in kilograms, per dayPC = price of chicken meat (in pesos per kilogram)I = income of average consumer (in pesos per day)PB=price of beef (in pesos per kilogram)W=wage rate paid in the poultry business (in pesos per day)PF= price of mixed feeds (in pesos per kilogram) Demand: QD = 20 ___ 1.5PC____0.8 I ____ 0.6 PBSupply: QS = - 20 ___ 4.5PC____0.5 W ____ 3 PFb. Suppose the other variable affecting the demand for and supply of chicken meat have the followingvalues: I = P300/day ; PB = P100/kg; W = P100/day; PF = P10/kgi. Derive the simple demand and supply equations where Q is a function of P.ii. Solve for the equilibrium price and quantity in the market.iii. Suppose the government imposes a price ceiling of P50/kg:1. What happens…Consider the market for product ABC, when the price is at Php 12, quantity demanded is 6 units and quantity supplied is 3 units. An eight pesos increase in the price would change quantity demanded by 2 units and quantity supplied by 4 units. How many units is the quantity demanded when product ABC is for free? A one peso increase in the price of the product would _ quantity supplied by _ units.How many units is the equilibrium quantity? shortage ; 3.75 6decrease ; 0.25shortage ; 1.536increase ; 0.5-39 increase ; 0.25 5decrease ; 0.5 surplus ; 1.5 16surplus ; 3.75PLEASE ANSWER c The Market for Chicken Meat in Davao Citya. Fill in the missing algebraic signs ( + or -) of the demand and supply equations for chicken meat belowaccording to the hypothesized direction of relationships. where:Q = quantity of chicken meat in kilograms, per dayPC = price of chicken meat (in pesos per kilogram)I = income of average consumer (in pesos per day)PB=price of beef (in pesos per kilogram)W=wage rate paid in the poultry business (in pesos per day)PF= price of mixed feeds (in pesos per kilogram) Demand: QD = 20 ___ 1.5PC____0.8 I ____ 0.6 PBSupply: QS = - 20 ___ 4.5PC____0.5 W ____ 3 PFb. Suppose the other variable affecting the demand for and supply of chicken meat have the followingvalues: I = P300/day ; PB = P100/kg; W = P100/day; PF = P10/kgi. Derive the simple demand and supply equations where Q is a function of P.ii. Solve for the equilibrium price and quantity in the market.iii. Suppose the government imposes a price ceiling of P50/kg:1. What happens…
- Please answer Part 1. Using the information below, construct the Supply and Use table for Balowamma.Part 1. i. Corn was imported by the agricultural sector (100,000) and 80% used by the sector. ii. Manufacturing industry utilizes 20% of imported corn to produce bread which is sold to government, private sector and hotels equally. iii. Household sector and private sector utilize the remaining corn equallyPart 2. i. Oil refinery imported $720,000 worth of crude oil to produce. ii Oil refinery uses crude oil to produce $500,000 worth of petrol and $220,000 worth of diesel. iii Household purchased (40%) of petrol government (30%), manufacturing (10 %) and exports (20%).Part 3.$5000 was paid as wages in for workers in the agricultural and manufacturing sector.Tax on the production of petrol was $7000.Using the information below, construct the Supply and Use table for Balowamma.1. Oil refinery imported $720,000 worth of crude oil to produce.2. Oil refinery uses crude oil to produce $500,000 worth of petrol and $220,000 worth of diesel.3. Household purchased (40%) of petrol government (30%), manufacturing (10 %) and exports (20%).Need solution!! ASAP PLEASE TYSM 1. Given the hypothetical demand of product (y) in a known market are Demand (D1) = 500, 400, 100, 200, and 300. Construct the demand curve and shift in the demand curve if prices in peso will start from 100php with an interval of 100php each. 2. Where is the shift if Demand (D2) will increase to 100? Show it graphically. 3. How will you explain the graph? 4. Use pen and graphing paper or Microsoft Excel to plot. 5. Please consider the law of demand in crafting the demand schedule.

