Discuss and interpret the relation strength and direction indicated by this statistic. Test your hypothesis. Report your decision. Then, report your results using standard APA format (see page 509 in your text).
Discuss and interpret the relation strength and direction indicated by this statistic. Test your hypothesis. Report your decision. Then, report your results using standard APA format (see page 509 in your text).

College Algebra (MindTap Course List)
12th Edition
ISBN:9781305652231
Author:R. David Gustafson, Jeff Hughes
Publisher:R. David Gustafson, Jeff Hughes
Chapter8: Sequences, Series, And Probability
Section8.7: Probability
Problem 5E: List the sample space of each experiment. Rolling one die and tossing one coin

Related questions
Question
ssume that your sample(s) comes from a
Please show all work. State the null hypothesis and alternative hypothesis. State your decision in terms of the null hypothesis and the alpha level. State your results in standard APA format.
- What, if any relationship, exists between self-reported height for females and self-reported weight for the same female participants?
- Write a null and an alternative hypothesis for this research question (you may want to review Example 15.7 and Example 15.8 on page 508).
- Determine the relationship between the two measures for this sample
(calculate r).
- Discuss and interpret the relation strength and direction indicated by this statistic.
- Test your hypothesis.
- Report your decision. Then, report your results using standard APA format (see page 509 in your text).
Please only solve the last 3 bullets
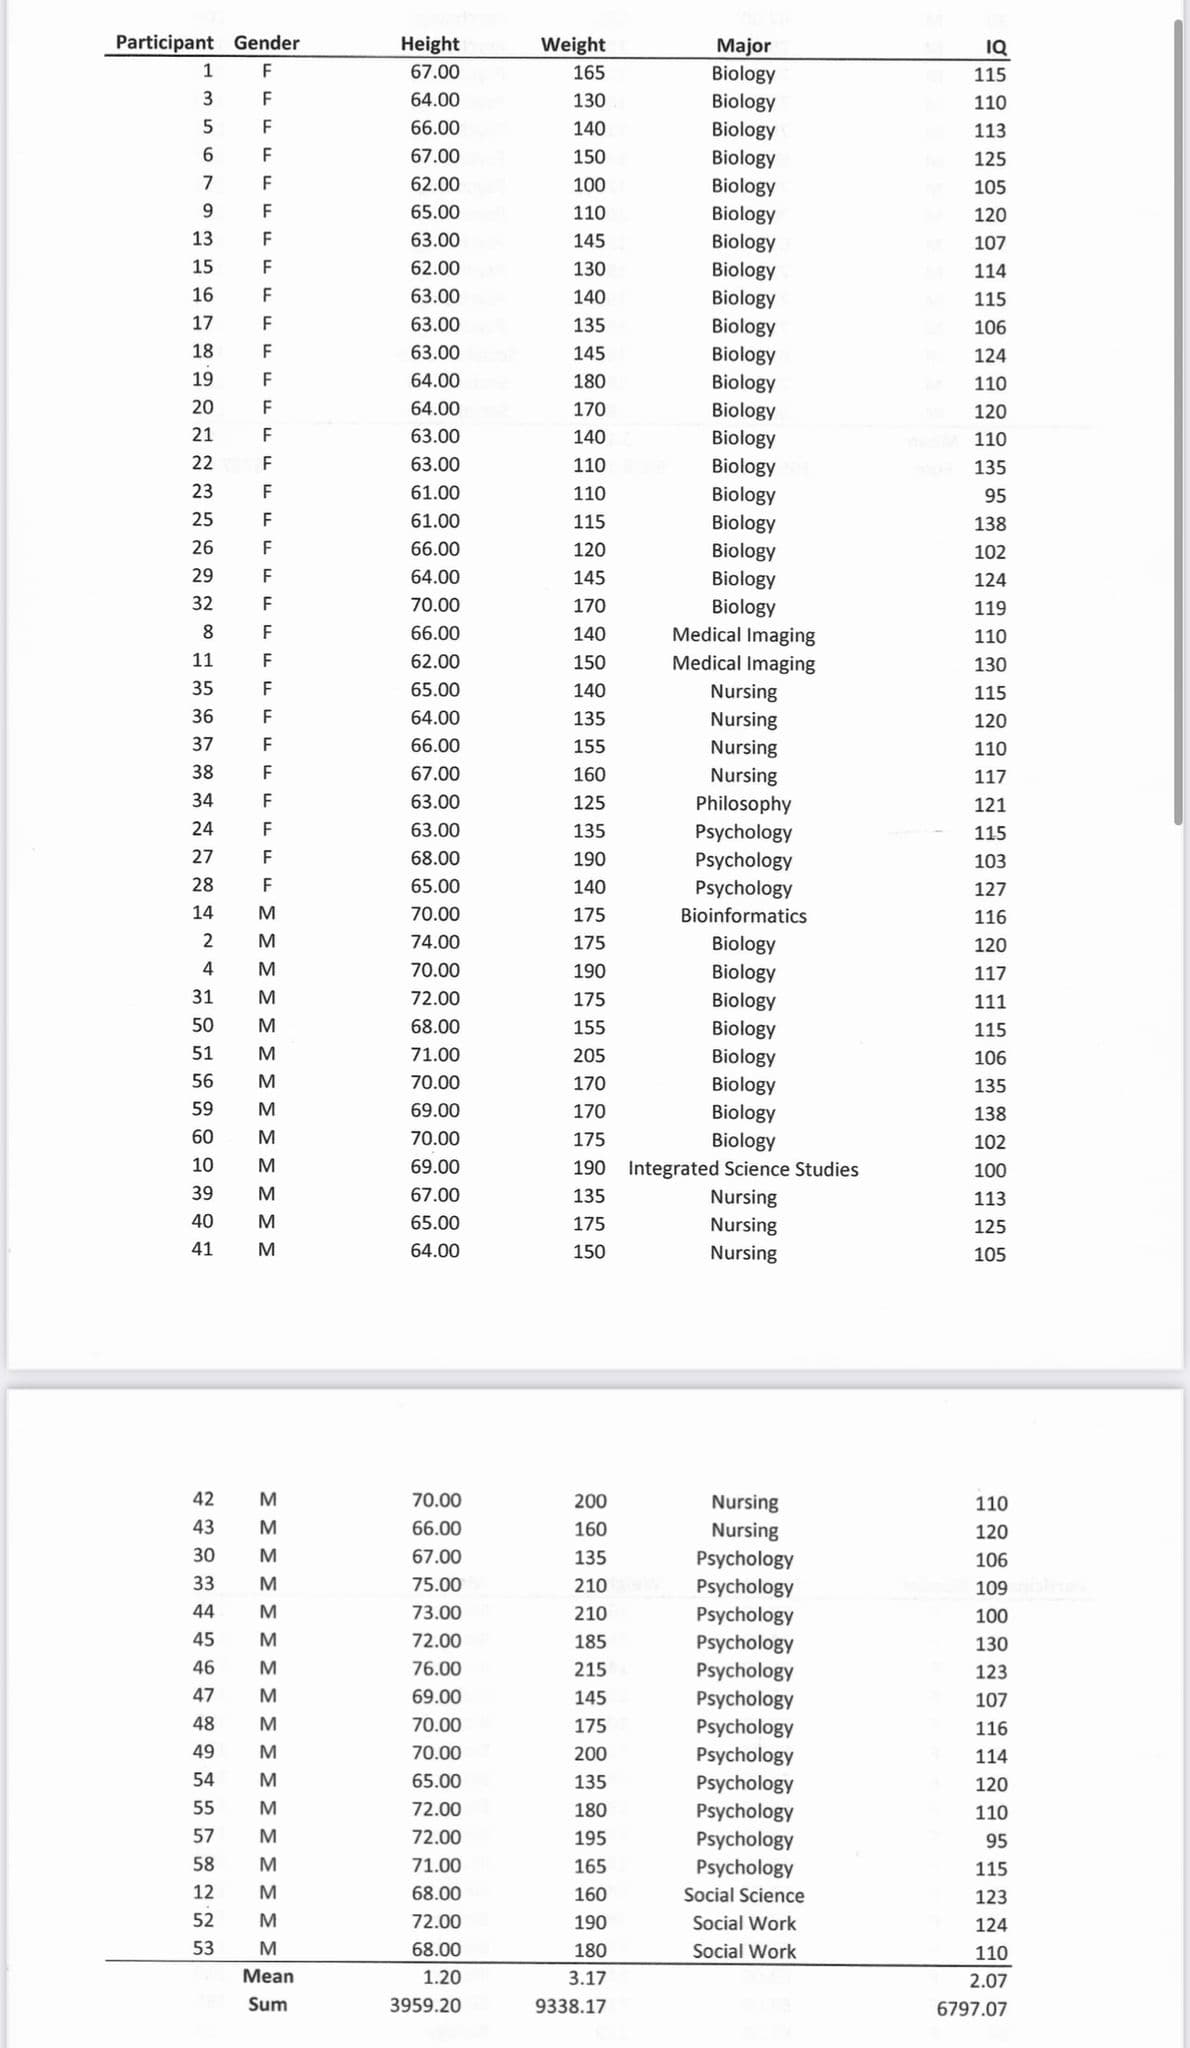
Transcribed Image Text:Participant Gender
Height
67.00
Weight
Major
Biology
Biology
Biology
Biology
Biology
Biology
IQ
1
F
165
115
3
F
64.00
130
110
5
F
66.00
140
113
F
67.00
150
125
7
F
62.00
100
105
9
F
65.00
110
120
13
F
63.00
Biology
Biology
Biology
Biology
Biology
145
107
15
F
62.00
130
114
16
F
63.00
140
115
17
F
63.00
135
106
18
F
63.00
145
124
19
F
64.00
Biology
Biology
Biology
Biology
Biology
Biology
Biology
180
110
20
F
64.00
170
120
21
F
63.00
140
110
22
F
63.00
110
135
23
F
61.00
110
95
25
F
61.00
115
138
26
F
66.00
120
102
29
F
64.00
145
Biology
Biology
Medical Imaging
124
32
F
70.00
170
119
8
F
66.00
140
110
11
F
62.00
150
Medical Imaging
130
35
F
65.00
140
Nursing
115
36
F
64.00
135
Nursing
120
37
F
66.00
155
Nursing
Nursing
110
38
F
67.00
160
117
34
F
63.00
Philosophy
Psychology
Psychology
Psychology
Bioinformatics
125
121
24
F
63.00
135
115
27
F
68.00
190
103
28
F
65.00
140
127
14
M
70.00
175
116
74.00
Biology
Biology
Biology
175
120
4
M
70.00
190
117
31
M
72.00
175
111
50
M
68.00
155
Biology
115
51
M
71.00
Biology
Biology
205
106
56
M
70.00
170
135
59
69.00
170
Biology
138
60
M
70.00
Biology
190 Integrated Science Studies
175
102
10
M
69.00
100
39
M
67.00
135
Nursing
113
40
65.00
175
Nursing
125
41
M
64.00
150
Nursing
105
42
M
70.00
200
Nursing
Nursing
110
43
M
66.00
160
120
30
M
67.00
Psychology
Psychology
Psychology
135
106
33
M
75.00
210
109
44
M
73.00
210
100
45
72.00
185
Psychology
Psychology
Psychology
Psychology
Psychology
130
46
M
76.00
215
123
47
M
69.00
145
107
48
M
70.00
175
116
49
M
70.00
200
114
54
M
65.00
135
Psychology
Psychology
Psychology
Psychology
120
55
M
72.00
180
110
57
M
72.00
195
95
58
M
71.00
165
115
12
M
68.00
160
Social Science
123
52
M
72.00
190
Social Work
124
53
68.00
180
Social Work
110
Мean
1.20
3.17
2.07
Sum
3959.20
9338.17
6797.07
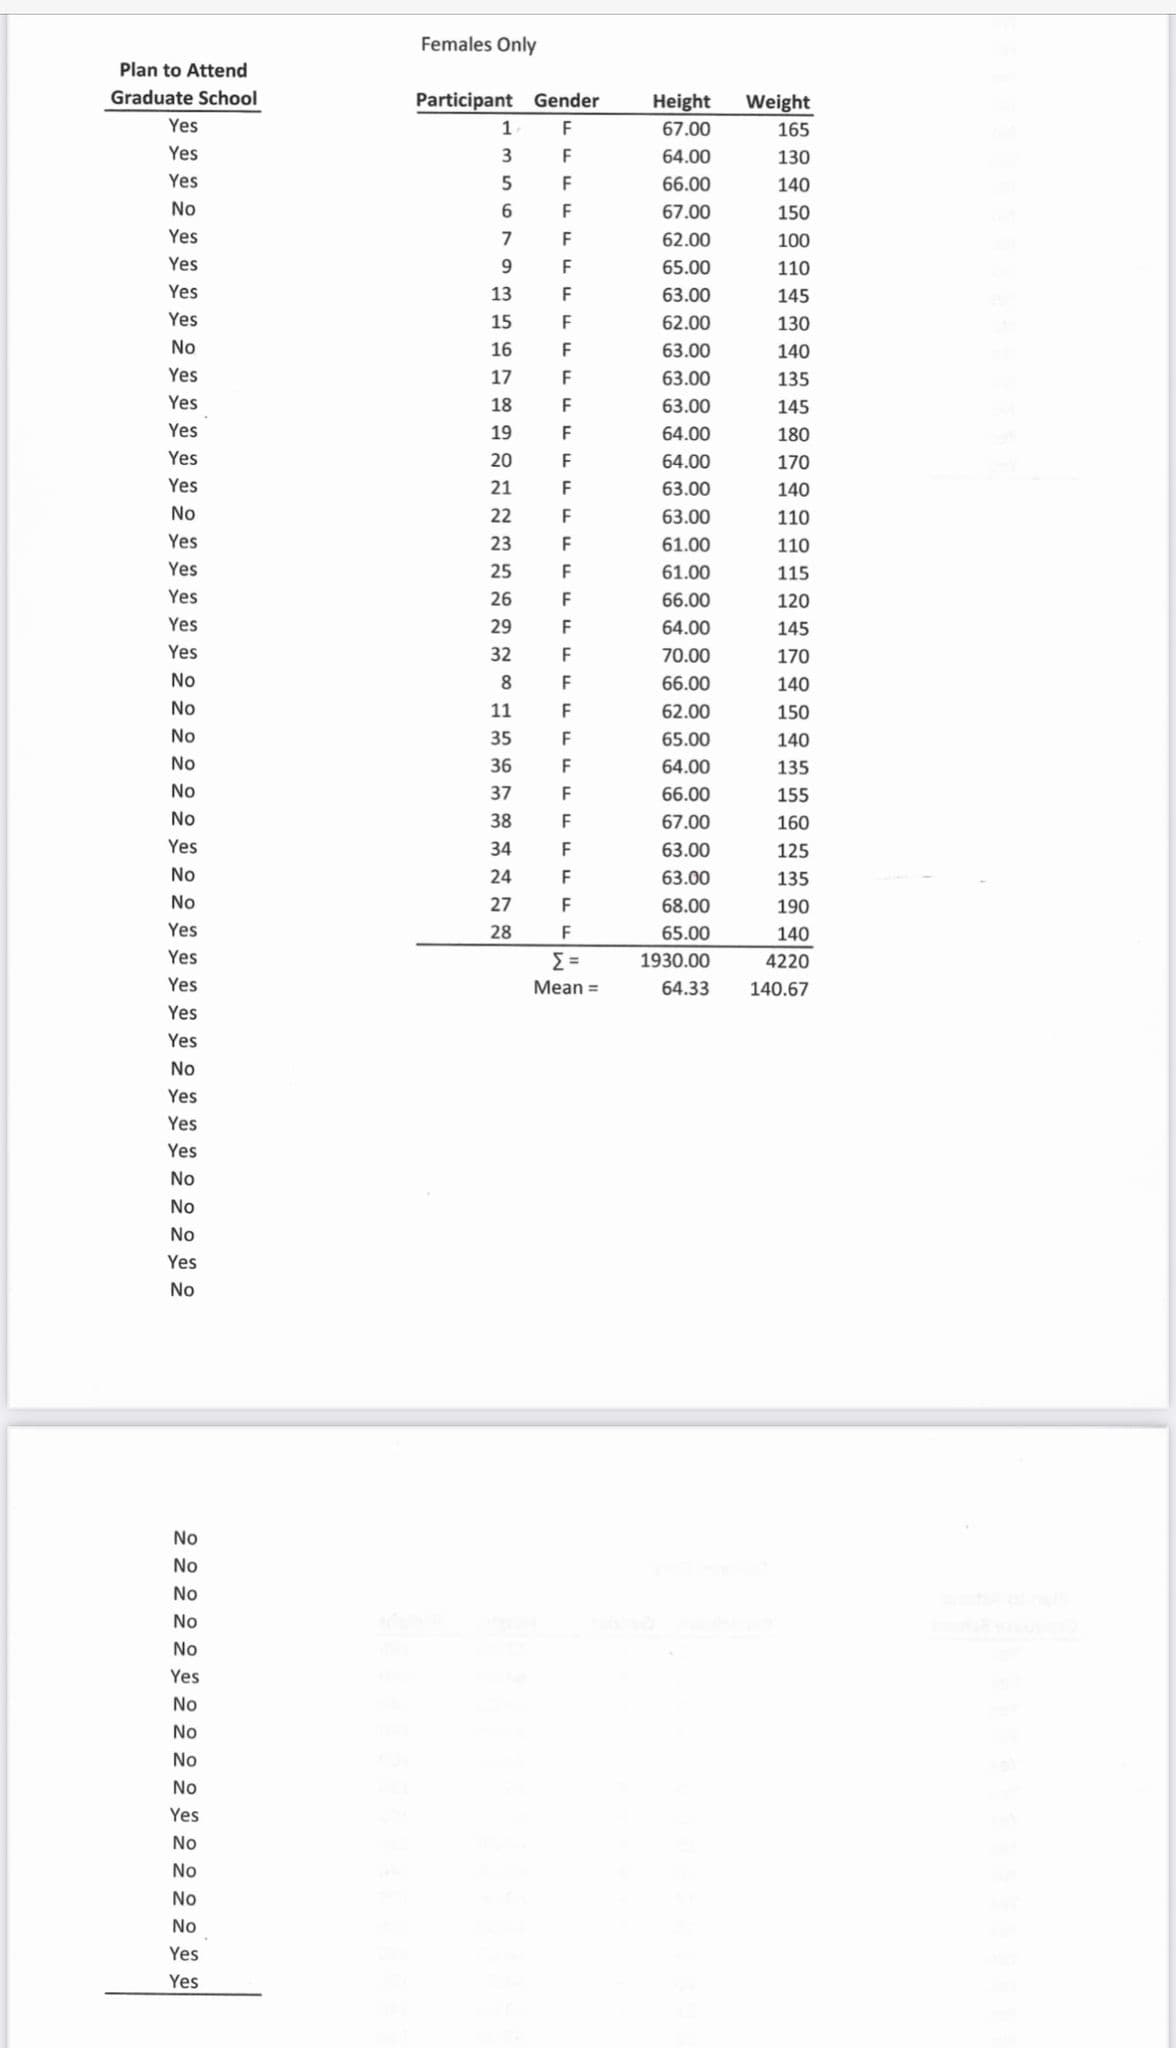
Transcribed Image Text:Females Only
Plan to Attend
Graduate School
Participant Gender
Height
67.00
Weight
Yes
1.
F
165
Yes
F
64.00
130
Yes
F
66.00
140
No
6.
67.00
150
Yes
7
F
62.00
100
Yes
9.
65.00
110
Yes
13
F
63.00
145
Yes
15
F
62.00
130
No
16
F
63.00
140
Yes
17
63.00
135
Yes
18
F
63.00
145
Yes
19
64.00
180
Yes
20
F
64.00
170
Yes
21
F
63.00
140
No
22
F
63.00
110
Yes
23
F
61.00
110
Yes
25
F
61.00
115
Yes
26
F
66.00
120
Yes
29
F
64.00
145
Yes
32
F
70.00
170
No
8.
F
66.00
140
No
11
F
62.00
150
No
35
F
65.00
140
No
36
F
64.00
135
No
37
F
66.00
155
No
38
F
67.00
160
Yes
34
F
63.00
125
No
24
F
63.00
135
No
27
F
68.00
190
Yes
28
F
65.00
140
Yes
1930.00
4220
Yes
Mean =
64.33
140.67
Yes
Yes
No
Yes
Yes
Yes
No
No
No
Yes
No
No
No
No
No
No
Yes
No
No
No
No
Yes
No
No
No
No
Yes
Yes
Expert Solution
This question has been solved!
Explore an expertly crafted, step-by-step solution for a thorough understanding of key concepts.

Step by step
Solved in 2 steps

Recommended textbooks for you
College Algebra (MindTap Course List)
Algebra
ISBN:
9781305652231
Author:
R. David Gustafson, Jeff Hughes
Publisher:
Cengage Learning


Holt Mcdougal Larson Pre-algebra: Student Edition…
Algebra
ISBN:
9780547587776
Author:
HOLT MCDOUGAL
Publisher:
HOLT MCDOUGAL
College Algebra (MindTap Course List)
Algebra
ISBN:
9781305652231
Author:
R. David Gustafson, Jeff Hughes
Publisher:
Cengage Learning
Holt Mcdougal Larson Pre-algebra: Student Edition…
Algebra
ISBN:
9780547587776
Author:
HOLT MCDOUGAL
Publisher:
HOLT MCDOUGAL