Discuss the similarities and the differences in the graphs of future value A as a function of time t if $1,000 is invested for 8 years and interest is compounded monthly at annual rates of 4%, 8%, and 12%, respectively (see the figure below.) A Q 3,000- 12% 2,600- G 2,200- 1,800- 1,400- 1,000 S Time (years) The similarities are that all the graphs start at is the rate at which the values of A ▼ and show A 1000 0 1 as t on the value of the The difference
Discuss the similarities and the differences in the graphs of future value A as a function of time t if $1,000 is invested for 8 years and interest is compounded monthly at annual rates of 4%, 8%, and 12%, respectively (see the figure below.) A Q 3,000- 12% 2,600- G 2,200- 1,800- 1,400- 1,000 S Time (years) The similarities are that all the graphs start at is the rate at which the values of A ▼ and show A 1000 0 1 as t on the value of the The difference

Algebra & Trigonometry with Analytic Geometry
13th Edition
ISBN:9781133382119
Author:Swokowski
Publisher:Swokowski
Chapter5: Inverse, Exponential, And Logarithmic Functions
Section: Chapter Questions
Problem 6DE

Related questions
Question
12 other options are increasing or decreasing
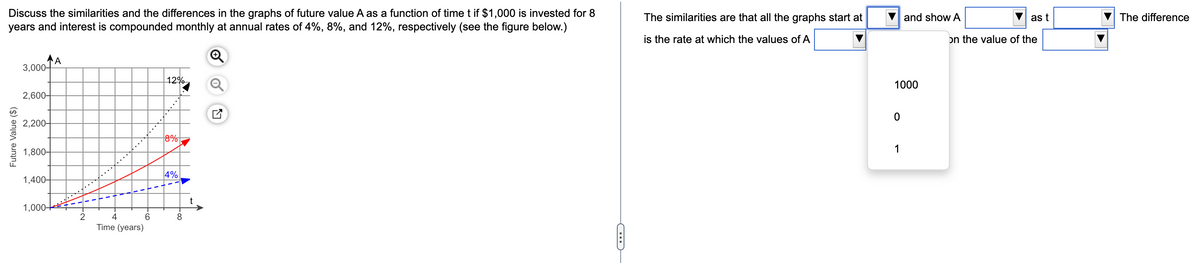
Transcribed Image Text:Discuss the similarities and the differences in the graphs of future value A as a function of time t if $1,000 is invested for 8
years and interest is compounded monthly at annual rates of 4%, 8%, and 12%, respectively (see the figure below.)
A
3,000-
12%
2,600-
2,200-
8%
1,800-
4%
1,400-
1,000+
Future Value ($)
2
4
Time (years)
6
- 00
8
A
K
The similarities are that all the graphs start at
is the rate at which the values of A
and show A
1000
0
1
as t
on the value of the
The difference
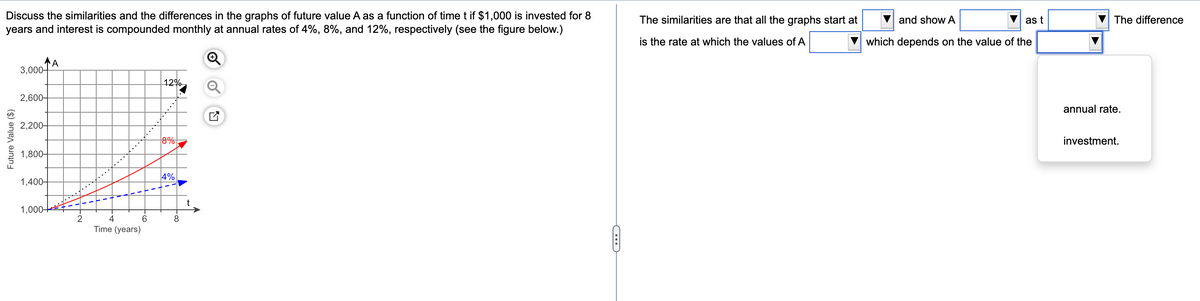
Transcribed Image Text:Discuss the similarities and the differences in the graphs of future value A as a function of time t if $1,000 is invested for 8
years and interest is compounded monthly at annual rates of 4%, 8%, and 12%, respectively (see the figure below.)
A
3,000+
12%
2,600-
2,200-
1,800-
1,400-
1,000-
Future Value ($)
2
Time (years)
-co
6
8%
4%
- 00
▶
8
C
The similarities are that all the graphs start at
is the rate at which the values of A
as t
and show A
which depends on the value of the
The difference
annual rate.
investment.
Expert Solution
This question has been solved!
Explore an expertly crafted, step-by-step solution for a thorough understanding of key concepts.

This is a popular solution!

Trending now
This is a popular solution!

Step by step
Solved in 2 steps with 1 images

Recommended textbooks for you
Algebra & Trigonometry with Analytic Geometry
Algebra
ISBN:
9781133382119
Author:
Swokowski
Publisher:
Cengage

Glencoe Algebra 1, Student Edition, 9780079039897…
Algebra
ISBN:
9780079039897
Author:
Carter
Publisher:
McGraw Hill

College Algebra (MindTap Course List)
Algebra
ISBN:
9781305652231
Author:
R. David Gustafson, Jeff Hughes
Publisher:
Cengage Learning
Algebra & Trigonometry with Analytic Geometry
Algebra
ISBN:
9781133382119
Author:
Swokowski
Publisher:
Cengage
Glencoe Algebra 1, Student Edition, 9780079039897…
Algebra
ISBN:
9780079039897
Author:
Carter
Publisher:
McGraw Hill
College Algebra (MindTap Course List)
Algebra
ISBN:
9781305652231
Author:
R. David Gustafson, Jeff Hughes
Publisher:
Cengage Learning

Functions and Change: A Modeling Approach to Coll…
Algebra
ISBN:
9781337111348
Author:
Bruce Crauder, Benny Evans, Alan Noell
Publisher:
Cengage Learning