Distance 1.8 1.6- 1.4 1.2 1. 0.8 0.6 0.4 0.2 0. ŷ= 5 ● 10 ● ● 15 20 Number ● ● 25 30 35 (b) Does a simple linear regression model appear to be appropriate? Explain. No, the scatter diagram suggests that there is a curvilinear relationship. O Yes, the scatter diagram suggests that there is a linear relationship. O No, the scatter diagram suggests that there is no relationship. (c) Develop an estimated regression equation for the data corresponding to a second-order model with one predictor variable. (Round your numerical values to four decimal places.)
Distance 1.8 1.6- 1.4 1.2 1. 0.8 0.6 0.4 0.2 0. ŷ= 5 ● 10 ● ● 15 20 Number ● ● 25 30 35 (b) Does a simple linear regression model appear to be appropriate? Explain. No, the scatter diagram suggests that there is a curvilinear relationship. O Yes, the scatter diagram suggests that there is a linear relationship. O No, the scatter diagram suggests that there is no relationship. (c) Develop an estimated regression equation for the data corresponding to a second-order model with one predictor variable. (Round your numerical values to four decimal places.)

Glencoe Algebra 1, Student Edition, 9780079039897, 0079039898, 2018
18th Edition
ISBN:9780079039897
Author:Carter
Publisher:Carter
Chapter10: Statistics
Section10.3: Measures Of Spread
Problem 25PFA

Related questions
Question
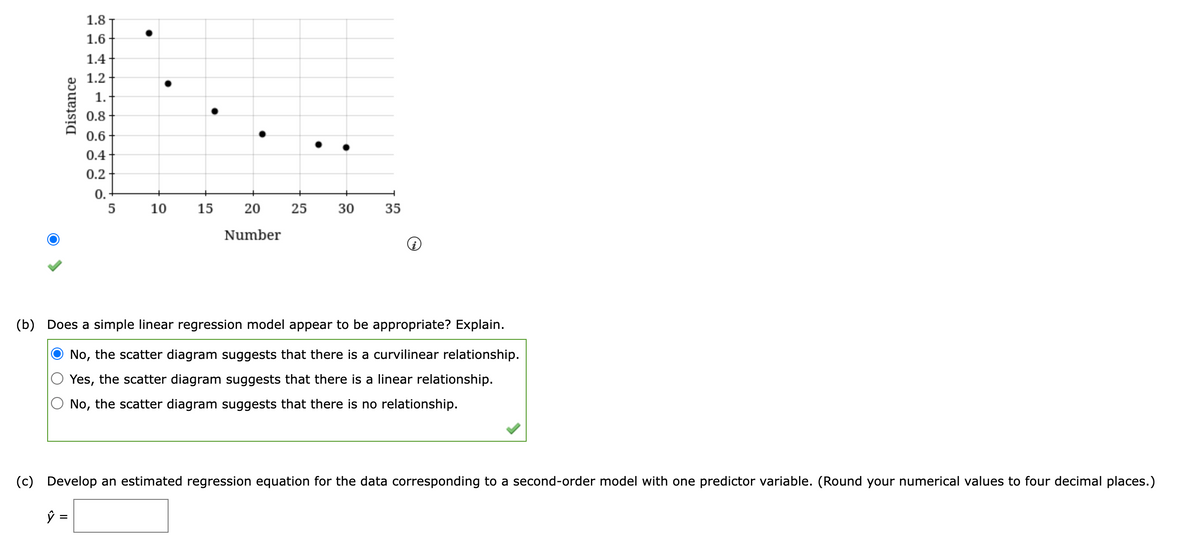
Transcribed Image Text:Distance
1.8
1.6
1.4
1.2
1.
0.8
0.6
0.4
0.2
0.
5
10
15
20
Number
25
30
H
35
(b) Does a simple linear regression model appear to be appropriate? Explain.
No, the scatter diagram suggests that there is a curvilinear relationship.
Yes, the scatter diagram suggests that there is a linear relationship.
No, the scatter diagram suggests that there is no relationship.
(c) Develop an estimated regression equation for the data corresponding to a second-order model with one predictor variable. (Round your numerical values to four decimal places.)
ŷ =
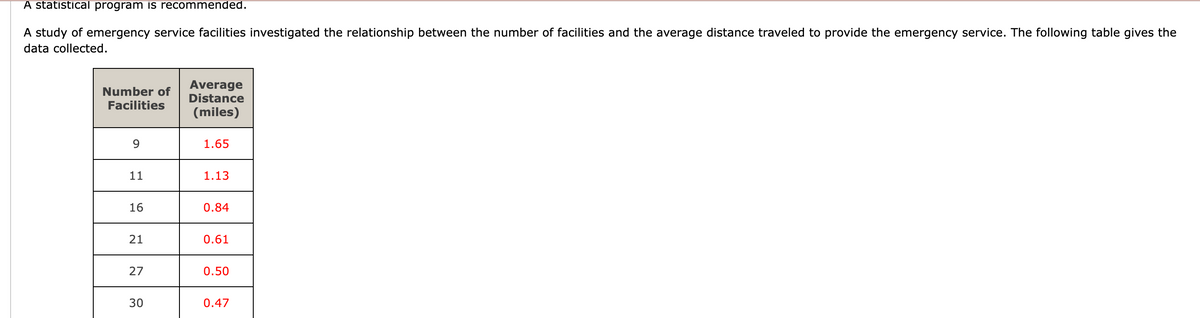
Transcribed Image Text:A statistical program is recommended.
A study of emergency service facilities investigated the relationship between the number of facilities and the average distance traveled to provide the emergency service. The following table gives the
data collected.
Number of
Facilities
9
11
16
21
27
30
Average
Distance
(miles)
1.65
1.13
0.84
0.61
0.50
0.47
Expert Solution
This question has been solved!
Explore an expertly crafted, step-by-step solution for a thorough understanding of key concepts.

Step by step
Solved in 3 steps

Recommended textbooks for you
Glencoe Algebra 1, Student Edition, 9780079039897…
Algebra
ISBN:
9780079039897
Author:
Carter
Publisher:
McGraw Hill
Glencoe Algebra 1, Student Edition, 9780079039897…
Algebra
ISBN:
9780079039897
Author:
Carter
Publisher:
McGraw Hill