distributed

MATLAB: An Introduction with Applications
6th Edition
ISBN:9781119256830
Author:Amos Gilat
Publisher:Amos Gilat
Chapter1: Starting With Matlab
Section: Chapter Questions
Problem 1P

Related questions
Question
Assume that 21 year old woman’s heart rate at rest I normally distributed with a mean of 62 bpm and a standard deviation of 4 bpm. If 400 women are examined, how many would you expect to have a heart rate of less than 64?
How many women out of 400 would you expect to have a heart rate of less than 64?
(Type answer as a whole number)
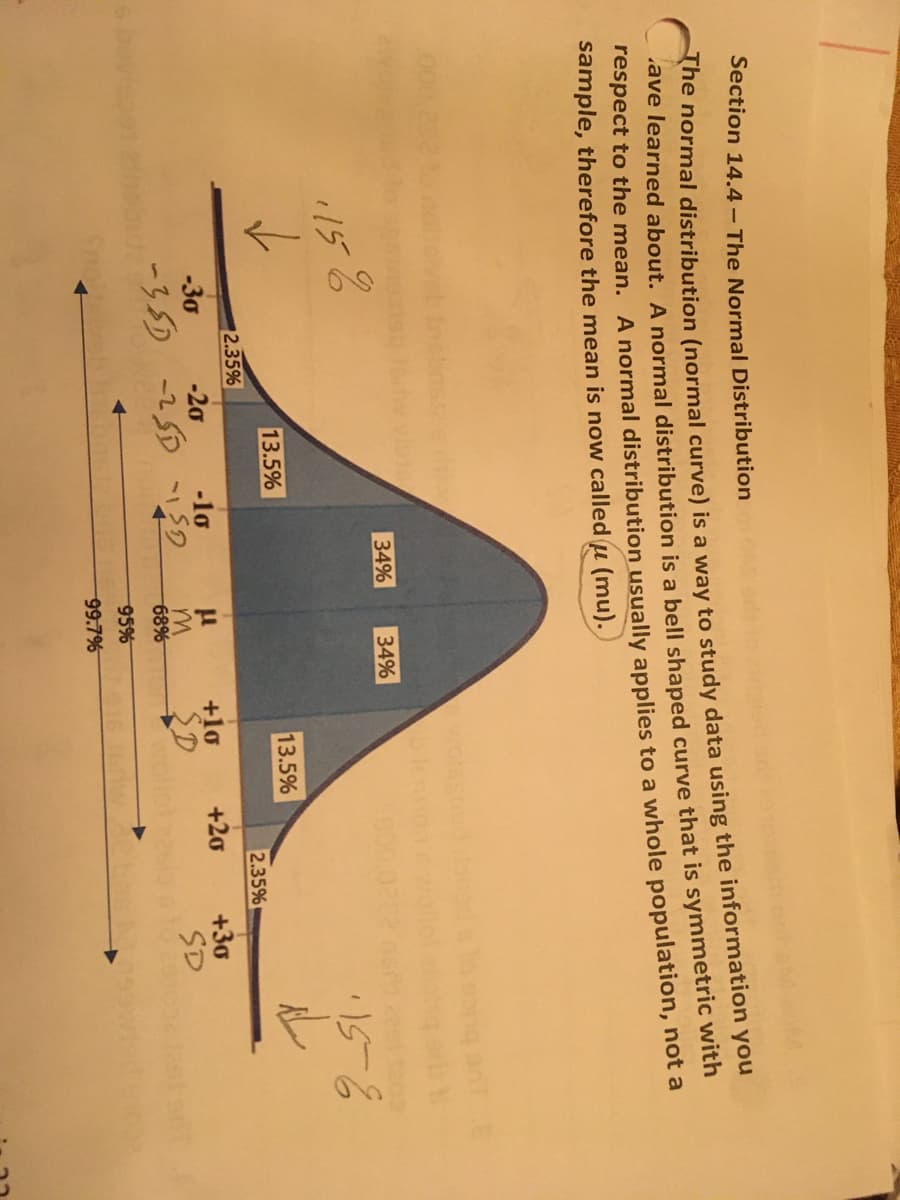
Transcribed Image Text:Section 14.4- The Normal Distribution
The normal distribution (normal curve) is a way to study data using the information you
ave learned about. A normal distribution is a bell shaped curve that is symmetric with
respect to the mean. A normal distribution usually applies to a whole population, not a
sample, therefore the mean is now called u (mu).
34%
34%
1158
✓
·15-6
13.5%
2.35%
-30
-20
-10
-35D -25D -SD
Sno Lambh
m
68%
95%
99.7%
13.5%
+10
SD
+20
2.35%
+3a
SD
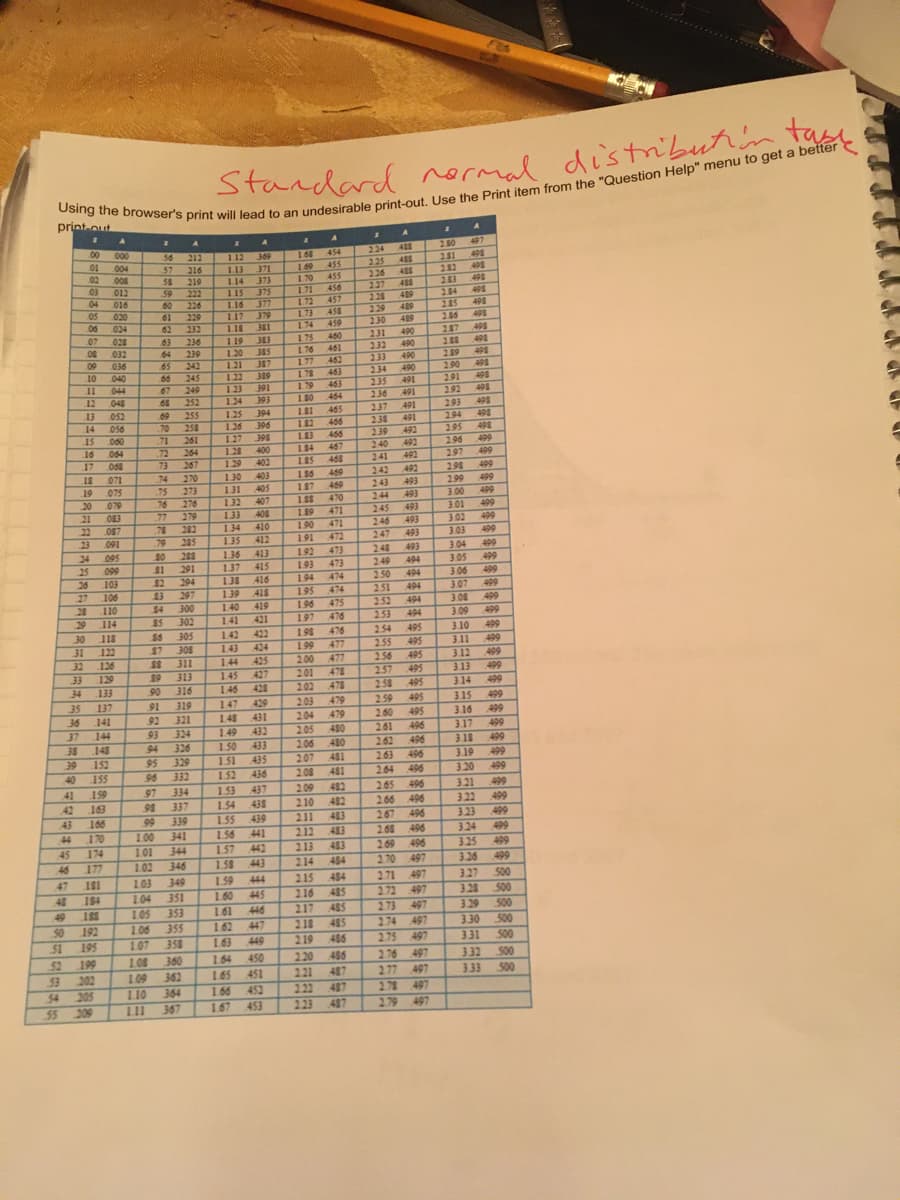
Transcribed Image Text:Standard normal.
distribution take
Using the browser's print will lead to an undesirable print-out. Use the Print item from the "Question Help" menu to get a better
print-out
A
2
A
A
1
A
A
I
A
*
00 000
2.50
56
213
1.12
369
1.68
2.81
498
01 004
02
57
216
1.13 371
1.69
455
2.83
498
58 219
1.14 373
1.70
455
498
03
2.83
012
59 222
1.15 375
1.71
456
495
2.84
04 016
.60 226
1.16
377
1.72
457
498
2.85
05 020
229
1.17
379
1.73
458
498
2.36
024
62 232
1.18
381
459
1.74
287 498
028
63
236
1.19 383
460
175
2.88
498
032
64
239
1.20
385
461
1.76
498
2.89
65
1.77
1.21 387
462
2.90
498
245
1.22
309
1.78
463
498
2.91
249
1.23
1.79
391
463
498
2.92
252
1.24
393
464
1.80
498
2.93
255
1.25
1.81
394
465
2.94 498
70 258
1.36
396
1.82
466
498
2.95
71
261
1.27
1.83
398
466
499
2.96
72 264
1.28
400
1.84
467
499
73
1.29
267
297
402
1.85
468
2.98 499
74
270
1.30
403
469
1.96
75
499
1.31
273
1.87
405
2.99
469
499
3.00
76
276
1.32
407
1.88
470
499
77
3.01
279
408
1.33
471
1.89
499
1.34
.78
3.02
410
1.90 471
.79
285
1.35
412
3.03 499
1.91
472
SO
1.36
288
413
3.04 499
1.92
473
$1
291
499
1.37
1.93
415
3.05
473
$2
294
1.38
416
194 474
3.06 499
£3
1.39
297
418
1.95
474
3.07
499
$4
300
1.40 419
1.96 475
3.08 499
85
302
1.41
421
197
476
3.09
499
$6 305
1.42
1.98
476
3.10
499
$7
308
1.43
1.99 477
3.11
499
$$ 311
1.44
425
2.00 477
3.12
499
1.45
313
427
201
499
3.13
90 316
1.46
428
202
3.14
499
91 319
1.47 429
2.03
479
3.15 499
92
321
1.48
431
204
479
499
3.16
3.17 499
93
324
1.49
2.05
480
94
326
1.50
433
2.06
480
3.18
499
3.19 499
95
329
1.51
435
207
481
96
332
1.52
436
2.08 481
3.20
499
97
334
1.53
437
2.09
482
3.21
499
98
337
1.54 438
2.10
482
3.22
499
99
339
1.55 439
211
483
3.23
499
1.00 341
1.56
441
212
483
3.24
499
344
1.57
2.13
483
3.25
499
1.01
1.02 346
1.58
214
484
3.26 499
1.59 444
215 484
3.27 500
1.03
341
1.04 351
1.60
445
216
485
3.28 500
353
1.61
446
217
485
3.29 500
1.62 447
2.18 485
3.30
500
404
1.63
449
219 486
3.31 500
1.64
450
2.20 486
3.32
500
1.65
451
2.21 487
3.33
500
1.66
452
2.22
1.67 453
2.23 487
48
49
05
51
1
53
54
55
90
07
30
071
075
20
079
21 083
22 087
23 091
24 095
25 099
26 103
27
106
28 110
29
114
30
118
31 122
32 126
33
129
34 133
35
137
36
141
37
144
38
148
39
152
40
155
41
159
42
163
43
44 170
45 174
46 177
47
181
194
09 036
10 040
11
044
12
048
13 052
14
056
15
16
17
18
19
991
S$1
192
195
199
900
202
205
209
090
064
890
19
293
99
67
68
69
65
1.05
1.06
355
1.07
358
1.08 360
1.09
362
1.10 364
1.11
367
442
T
SSY
224
2.25
485
226 ASS
227
418
2.28
409
229 489
2.30
231 490
2.32
490
2.33
490
234
490
2.35
491
2.36
491
237
491
2.38
491
2.39
492
240
492
241
492
242
492
243 493
244
493
245
493
246
493
493
248
493
249
494
2.50
494
2.51
494
2.52
494
2.53
494
2.54
495
2.55
495
2.56
495
2.57 495
2.58
495
2.59
495
2.60 495
261
496
2.62
496
2.63
496
264 496
265 496
2.66
496
2.67
496
2.68
496
2.69 496
2.70 497
2.71 497
2.72 497
2.73
497
2.74
497
2.75 497
2.76 497
2.77 497
2.78 497
2.79 497
489
497
Expert Solution
This question has been solved!
Explore an expertly crafted, step-by-step solution for a thorough understanding of key concepts.

Step by step
Solved in 2 steps with 1 images

Recommended textbooks for you
MATLAB: An Introduction with Applications
Statistics
ISBN:
9781119256830
Author:
Amos Gilat
Publisher:
John Wiley & Sons Inc

Probability and Statistics for Engineering and th…
Statistics
ISBN:
9781305251809
Author:
Jay L. Devore
Publisher:
Cengage Learning

Statistics for The Behavioral Sciences (MindTap C…
Statistics
ISBN:
9781305504912
Author:
Frederick J Gravetter, Larry B. Wallnau
Publisher:
Cengage Learning
MATLAB: An Introduction with Applications
Statistics
ISBN:
9781119256830
Author:
Amos Gilat
Publisher:
John Wiley & Sons Inc
Probability and Statistics for Engineering and th…
Statistics
ISBN:
9781305251809
Author:
Jay L. Devore
Publisher:
Cengage Learning
Statistics for The Behavioral Sciences (MindTap C…
Statistics
ISBN:
9781305504912
Author:
Frederick J Gravetter, Larry B. Wallnau
Publisher:
Cengage Learning

Elementary Statistics: Picturing the World (7th E…
Statistics
ISBN:
9780134683416
Author:
Ron Larson, Betsy Farber
Publisher:
PEARSON

The Basic Practice of Statistics
Statistics
ISBN:
9781319042578
Author:
David S. Moore, William I. Notz, Michael A. Fligner
Publisher:
W. H. Freeman

Introduction to the Practice of Statistics
Statistics
ISBN:
9781319013387
Author:
David S. Moore, George P. McCabe, Bruce A. Craig
Publisher:
W. H. Freeman