Dixie Showtime Movie Theaters, Inc., owns and operates a chain of cinemas in several markets in the southem U.S. The owners would like to estimate weekly gross revenue as a function of advertising expenditures. Data for a sample of eight ma recent week follow. Weekly Gross Revenue Television Advertising Newspaper Advertising ($100s) Market ($100s) ($100s) Mobile 102.5 5.1 1.6 Shreveport 52.7 3.2 3.0 Jackson 75.8 4.0 1.5 Birmingham 127.8 4.3 4.0 Little Rock 137.8 3.5 4.3 Biloxi 101.4 3.6 2.3 New Orleans 237.8 5.0 8.4 Baton Rouge 219.6 6.9 5.8 (a) Use the data to develop an estimated regression equation with the amount of television advertising as the independent variable. Let x represent the amount of television advertising. If required, round your answers to three decimal places. For subtractive or negative numbers use a minus sign even if there is a - sign before the blank. (Example: -300) ☺. 39.367 Ox -43.258 Test for a significant relationship between television advertising and weekly gross revenue at the 0.05 level of significance. What is the interpretation of this relationship? The input in the box below will not be graded, but may be reviewed and considered by your instructor. blank (b) How much of the variation in the sample values of weekly gross revenue does the model in part (a) explain? If required, round your answer to two decimal places.
Dixie Showtime Movie Theaters, Inc., owns and operates a chain of cinemas in several markets in the southem U.S. The owners would like to estimate weekly gross revenue as a function of advertising expenditures. Data for a sample of eight ma recent week follow. Weekly Gross Revenue Television Advertising Newspaper Advertising ($100s) Market ($100s) ($100s) Mobile 102.5 5.1 1.6 Shreveport 52.7 3.2 3.0 Jackson 75.8 4.0 1.5 Birmingham 127.8 4.3 4.0 Little Rock 137.8 3.5 4.3 Biloxi 101.4 3.6 2.3 New Orleans 237.8 5.0 8.4 Baton Rouge 219.6 6.9 5.8 (a) Use the data to develop an estimated regression equation with the amount of television advertising as the independent variable. Let x represent the amount of television advertising. If required, round your answers to three decimal places. For subtractive or negative numbers use a minus sign even if there is a - sign before the blank. (Example: -300) ☺. 39.367 Ox -43.258 Test for a significant relationship between television advertising and weekly gross revenue at the 0.05 level of significance. What is the interpretation of this relationship? The input in the box below will not be graded, but may be reviewed and considered by your instructor. blank (b) How much of the variation in the sample values of weekly gross revenue does the model in part (a) explain? If required, round your answer to two decimal places.

Glencoe Algebra 1, Student Edition, 9780079039897, 0079039898, 2018
18th Edition
ISBN:9780079039897
Author:Carter
Publisher:Carter
Chapter10: Statistics
Section10.6: Summarizing Categorical Data
Problem 36PPS

Related questions
Question
100%
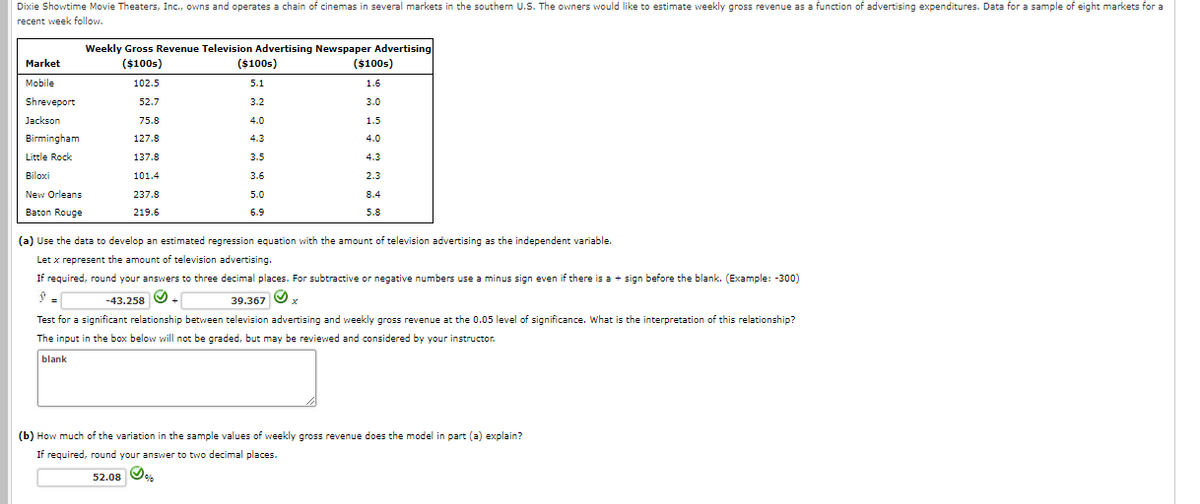
Transcribed Image Text:Dixie Showtime Movie Theaters, Inc., owns and operates a chain of cinemas in several markets in the southem U.S. The owners would like to estimate weekly gross revenue as a function of advertising expenditures. Data for a sample of eight markets for a
recent week follow.
Weekly Gross Revenue Television Advertising Newspaper Advertising
($100s)
Market
($100s)
($100s)
Mobile
102.5
5.1
1.6
Shreveport
52.7
3.2
3.0
Jackson
75.8
4.0
1.5
Birmingham
127.8
4.3
4.0
Little Rock
137.8
3.5
4.3
Biloxi
101.4
3.6
2.3
New Orleans
237.8
5.0
8.4
Baton Rouge
219.6
6.9
5.8
(a) Use the data to develop an estimated regression equation with the amount of television advertising as the independent variable.
Let x represent the amount of television advertising.
If required, round your answers to three decimal places. For subtractive or negative numbers use a minus sign even if there is a + sign before the blank. (Example: -300)
-43.258 O +
39.367
Test for a significant relationship between television advertising and weekly gross revenue at the 0.05 level of significance. What is the interpretation of this relationship?
The input in the box below will not be graded, but may be reviewed and considered by your instructor.
blank
(b) How much of the variation in the sample values of weekly gross revenue does the model in part (a) explain?
If required, round your answer to two decimal places.
52.08 O
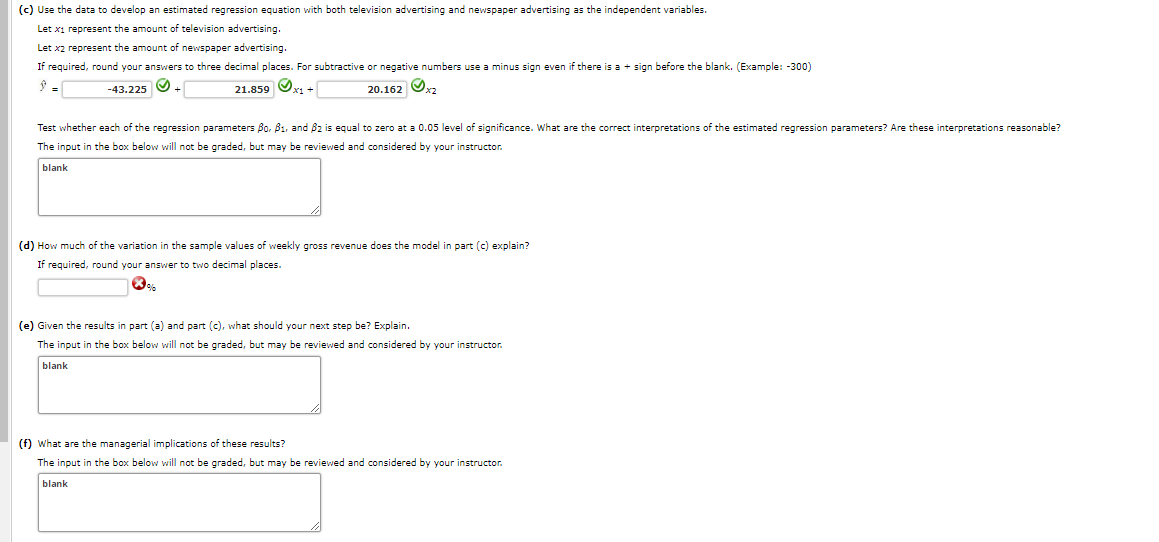
Transcribed Image Text:(c) Use the data to develop an estimated regression equation with both television advertising and newspaper advertising as the independent variables.
Let x1 represent the amount of television advertising.
Let x2 represent the amount of newspaper advertising.
If required, round your answers to three decimal places. For subtractive or negative numbers use a minus sign even if there is a + sign before the blank. (Example: -300)
-43.225 O
21.859 Ox: +
20.162 Ox7
Test whether each of the regression parameters Bo. B1, and 82 is equal to zero at a 0.05 level of significance. What are the correct interpretations of the estimated regression parameters? Are these interpretations reasonable?
The input in the box below will not be graded, but may be reviewed and considered by your instructor.
blank
(d) How much of the variation in the sample values of weekly gross revenue does the model in part (c) explain?
If required, round your answer to two decimal places.
(e) Given the results in part (a) and part (c), what should your next step be? Explain.
The input in the box below will not be graded, but may be reviewed and considered by your instructor.
blank
(f) what are the managerial implications of these results?
nput in the box below will not be
but
be reviewed and considered by your instructor.
blank
Expert Solution
This question has been solved!
Explore an expertly crafted, step-by-step solution for a thorough understanding of key concepts.

This is a popular solution!

Trending now
This is a popular solution!

Step by step
Solved in 3 steps with 2 images

Recommended textbooks for you
Glencoe Algebra 1, Student Edition, 9780079039897…
Algebra
ISBN:
9780079039897
Author:
Carter
Publisher:
McGraw Hill

Linear Algebra: A Modern Introduction
Algebra
ISBN:
9781285463247
Author:
David Poole
Publisher:
Cengage Learning

Big Ideas Math A Bridge To Success Algebra 1: Stu…
Algebra
ISBN:
9781680331141
Author:
HOUGHTON MIFFLIN HARCOURT
Publisher:
Houghton Mifflin Harcourt
Glencoe Algebra 1, Student Edition, 9780079039897…
Algebra
ISBN:
9780079039897
Author:
Carter
Publisher:
McGraw Hill
Linear Algebra: A Modern Introduction
Algebra
ISBN:
9781285463247
Author:
David Poole
Publisher:
Cengage Learning
Big Ideas Math A Bridge To Success Algebra 1: Stu…
Algebra
ISBN:
9781680331141
Author:
HOUGHTON MIFFLIN HARCOURT
Publisher:
Houghton Mifflin Harcourt