Trace metals in drinking water affect the flavor and an unusually high concentration can pose a health hazard. Ten pairs of data were taken measuring zinc concentration in bottom water and surface water of a water source. Zinc Location concentration in concentration in bottom water Zinc surface water 1 .430 .415 .266 .238 .567 .390 4 .531 .410 .707 .605 .716 .609 7 .651 .632 .589 .523 .469 .411 10 .723 .612 Do the data support that the zinc concentration is less on the surface than the bottom of the water source, at the a = 0.1 level of significance? Note: A normal probability plot of difference in zinc concentration between the bottom and surface of water indicates the population could be normal and a boxplot indicated no outliers. a. Express the null and alternative hypotheses in symbolic form for this claim. Assume Hã = H1 -42, where u1 is the population mean zinc concentration in the bottom of water and µ2 is the mean zinc concentration in the surface of water.
Trace metals in drinking water affect the flavor and an unusually high concentration can pose a health hazard. Ten pairs of data were taken measuring zinc concentration in bottom water and surface water of a water source. Zinc Location concentration in concentration in bottom water Zinc surface water 1 .430 .415 .266 .238 .567 .390 4 .531 .410 .707 .605 .716 .609 7 .651 .632 .589 .523 .469 .411 10 .723 .612 Do the data support that the zinc concentration is less on the surface than the bottom of the water source, at the a = 0.1 level of significance? Note: A normal probability plot of difference in zinc concentration between the bottom and surface of water indicates the population could be normal and a boxplot indicated no outliers. a. Express the null and alternative hypotheses in symbolic form for this claim. Assume Hã = H1 -42, where u1 is the population mean zinc concentration in the bottom of water and µ2 is the mean zinc concentration in the surface of water.

Big Ideas Math A Bridge To Success Algebra 1: Student Edition 2015
1st Edition
ISBN:9781680331141
Author:HOUGHTON MIFFLIN HARCOURT
Publisher:HOUGHTON MIFFLIN HARCOURT
Chapter11: Data Analysis And Displays
Section11.3: Shapes Of Distributions
Problem 20E

Related questions
Topic Video
Question
Trace metals in drinking water affect the flavor and unusually high concentration can pose a health hazard. Ten pairs of data were taken measuring zinc concentration in bottom water and surface water of a water source.
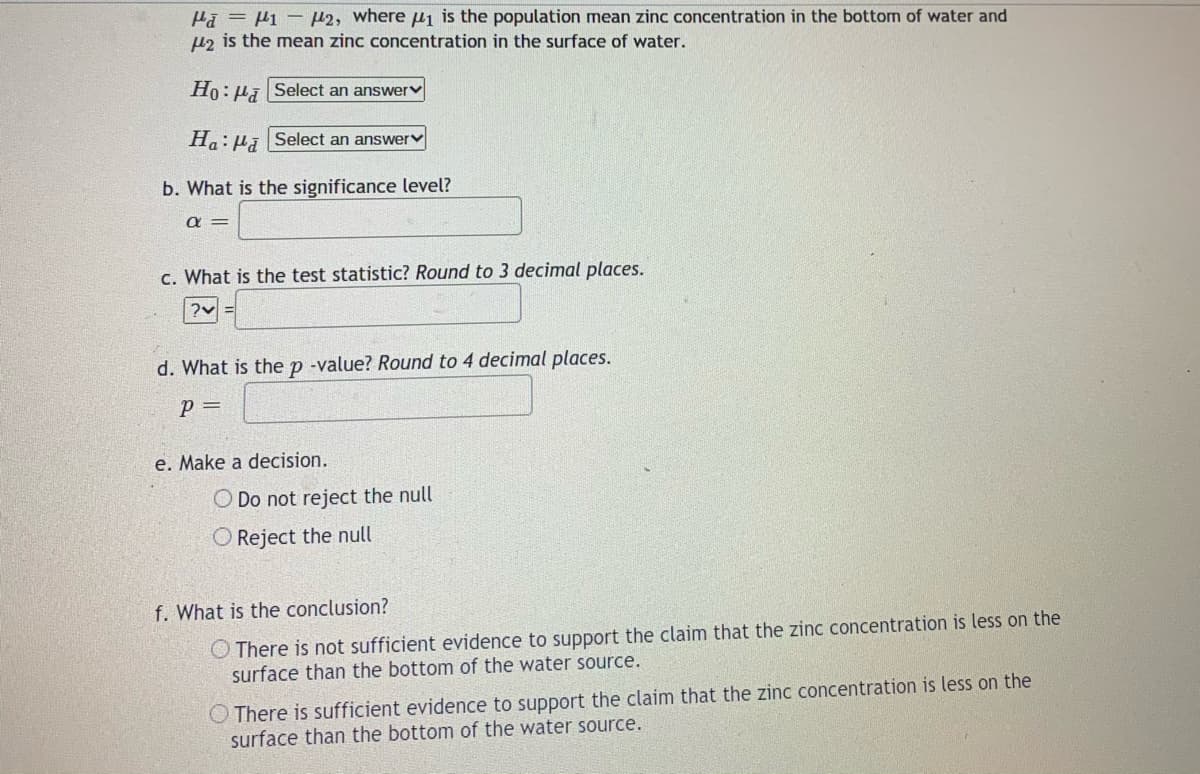
Transcribed Image Text:Hā = µ1 – H2, where µj is the population mean zinc concentration in the bottom of water and
uz is the mean zinc concentration in the surface of water.
Ho: Ha Select an answerv
H.:µi Select an answerv
b. What is the significance level?
a =
c. What is the test statistic? Round to 3 decimal places.
?v =
d. What is the p -value? Round to 4 decimal places.
p =
e. Make a decision.
O Do not reject the null
O Reject the null
f. What is the conclusion?
O There is not sufficient evidence to support the claim that the zinc concentration is less on the
surface than the bottom of the water source.
O There is sufficient evidence to support the claim that the zinc concentration is less on the
surface than the bottom of the water source.
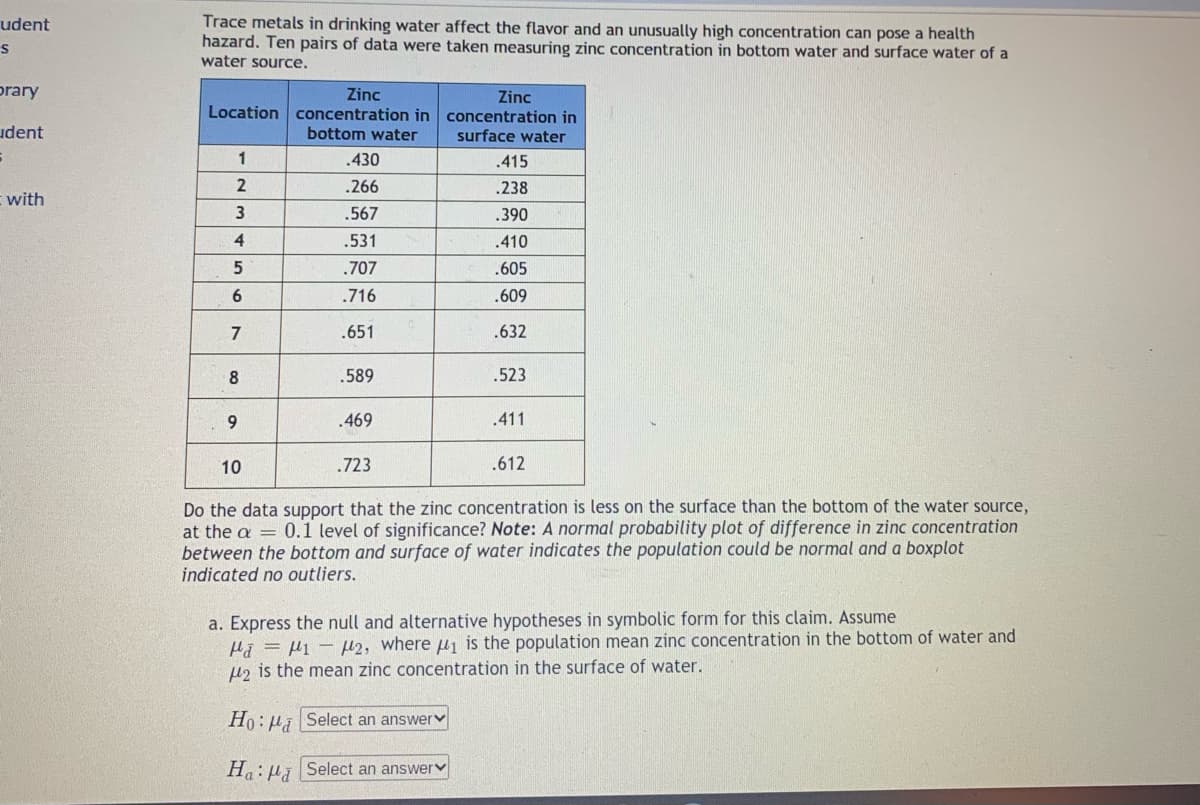
Transcribed Image Text:Trace metals in drinking water affect the flavor and an unusually high concentration can pose a health
hazard. Ten pairs of data were taken measuring zinc concentration in bottom water and surface water of a
water source.
udent
orary
Zinc
Zinc
Location concentration in concentration in
udent
bottom water
surface water
1
.430
.415
.266
.238
with
.567
.390
4
.531
.410
.707
.605
6.
.716
.609
.651
.632
8
.589
.523
.469
.411
10
.723
.612
Do the data support that the zinc concentration is less on the surface than the bottom of the water source,
at the a = 0.1 level of significance? Note: A normal probability plot of difference in zinc concentration
between the bottom and surface of water indicates the population could be normal and a boxplot
indicated no outliers.
a. Express the null and alternative hypotheses in symbolic form for this claim. Assume
Hã = H1 - H2, where u1 is the population mean zinc concentration in the bottom of water and
H2 is the mean zinc concentration in the surface of water.
Ho: µi Select an answerv
H:µi Select an answerv
Expert Solution
This question has been solved!
Explore an expertly crafted, step-by-step solution for a thorough understanding of key concepts.

This is a popular solution!

Trending now
This is a popular solution!

Step by step
Solved in 4 steps with 2 images

Knowledge Booster


Learn more about
Need a deep-dive on the concept behind this application? Look no further. Learn more about this topic, statistics and related others by exploring similar questions and additional content below.Recommended textbooks for you
Big Ideas Math A Bridge To Success Algebra 1: Stu…
Algebra
ISBN:
9781680331141
Author:
HOUGHTON MIFFLIN HARCOURT
Publisher:
Houghton Mifflin Harcourt

Linear Algebra: A Modern Introduction
Algebra
ISBN:
9781285463247
Author:
David Poole
Publisher:
Cengage Learning

Glencoe Algebra 1, Student Edition, 9780079039897…
Algebra
ISBN:
9780079039897
Author:
Carter
Publisher:
McGraw Hill
Big Ideas Math A Bridge To Success Algebra 1: Stu…
Algebra
ISBN:
9781680331141
Author:
HOUGHTON MIFFLIN HARCOURT
Publisher:
Houghton Mifflin Harcourt
Linear Algebra: A Modern Introduction
Algebra
ISBN:
9781285463247
Author:
David Poole
Publisher:
Cengage Learning
Glencoe Algebra 1, Student Edition, 9780079039897…
Algebra
ISBN:
9780079039897
Author:
Carter
Publisher:
McGraw Hill