Dlet Regular 2. Data on the weights (lb) of the contents of cans of diet soda versus the contents of cans of the regular version of the soda is summarized to the right. Assume that the two samples are independent simple random samples selected from normally distributed populations, and do not assume that the population standard deviations are equal. Complete parts (a) and (b) below. Use a 0.05 significance level for both parts. 24 24 0.79556 Ib 0.80619 Ib 0.00441 Ib 0.00743 Ib a. Test the claim that the contents of cans of diet soda have weights with a mean that is less than the mean for the regular soda. What are the null and altermative hypotheses? O B. Ho: H1 H2 H1: H1 H2 The test statistic, t, is (Round to two decimal places as needed.) The P-value is (Round to three decimal places as needed.) State the conclusion for the test. O A. Reject the null hypothesis. There is not sufficient evidence to support the claim that the cans of diet soda have mean weights that are lower than the mean weight for the regular soda. O B. Fail to reject the null hypothesis. There is not sufficient evidence to support the claim that the cans of diet soda have mean weights that are lower than the mean weight for the regular soda. O C. Reject the null hypothesis. There is sufficient evidence to support the claim that the cans of diet soda have mean weights that are lower than the mean weight for the regular soda. D. Fail to reject the null hypothesis. There is sufficient evidence to support the claim that the cans of diet soda have mean weights that are lower than the mean weight for the regular soda. unl annropriate for the hypothesis test in part (a).
Dlet Regular 2. Data on the weights (lb) of the contents of cans of diet soda versus the contents of cans of the regular version of the soda is summarized to the right. Assume that the two samples are independent simple random samples selected from normally distributed populations, and do not assume that the population standard deviations are equal. Complete parts (a) and (b) below. Use a 0.05 significance level for both parts. 24 24 0.79556 Ib 0.80619 Ib 0.00441 Ib 0.00743 Ib a. Test the claim that the contents of cans of diet soda have weights with a mean that is less than the mean for the regular soda. What are the null and altermative hypotheses? O B. Ho: H1 H2 H1: H1 H2 The test statistic, t, is (Round to two decimal places as needed.) The P-value is (Round to three decimal places as needed.) State the conclusion for the test. O A. Reject the null hypothesis. There is not sufficient evidence to support the claim that the cans of diet soda have mean weights that are lower than the mean weight for the regular soda. O B. Fail to reject the null hypothesis. There is not sufficient evidence to support the claim that the cans of diet soda have mean weights that are lower than the mean weight for the regular soda. O C. Reject the null hypothesis. There is sufficient evidence to support the claim that the cans of diet soda have mean weights that are lower than the mean weight for the regular soda. D. Fail to reject the null hypothesis. There is sufficient evidence to support the claim that the cans of diet soda have mean weights that are lower than the mean weight for the regular soda. unl annropriate for the hypothesis test in part (a).

MATLAB: An Introduction with Applications
6th Edition
ISBN:9781119256830
Author:Amos Gilat
Publisher:Amos Gilat
Chapter1: Starting With Matlab
Section: Chapter Questions
Problem 1P

Related questions
Question
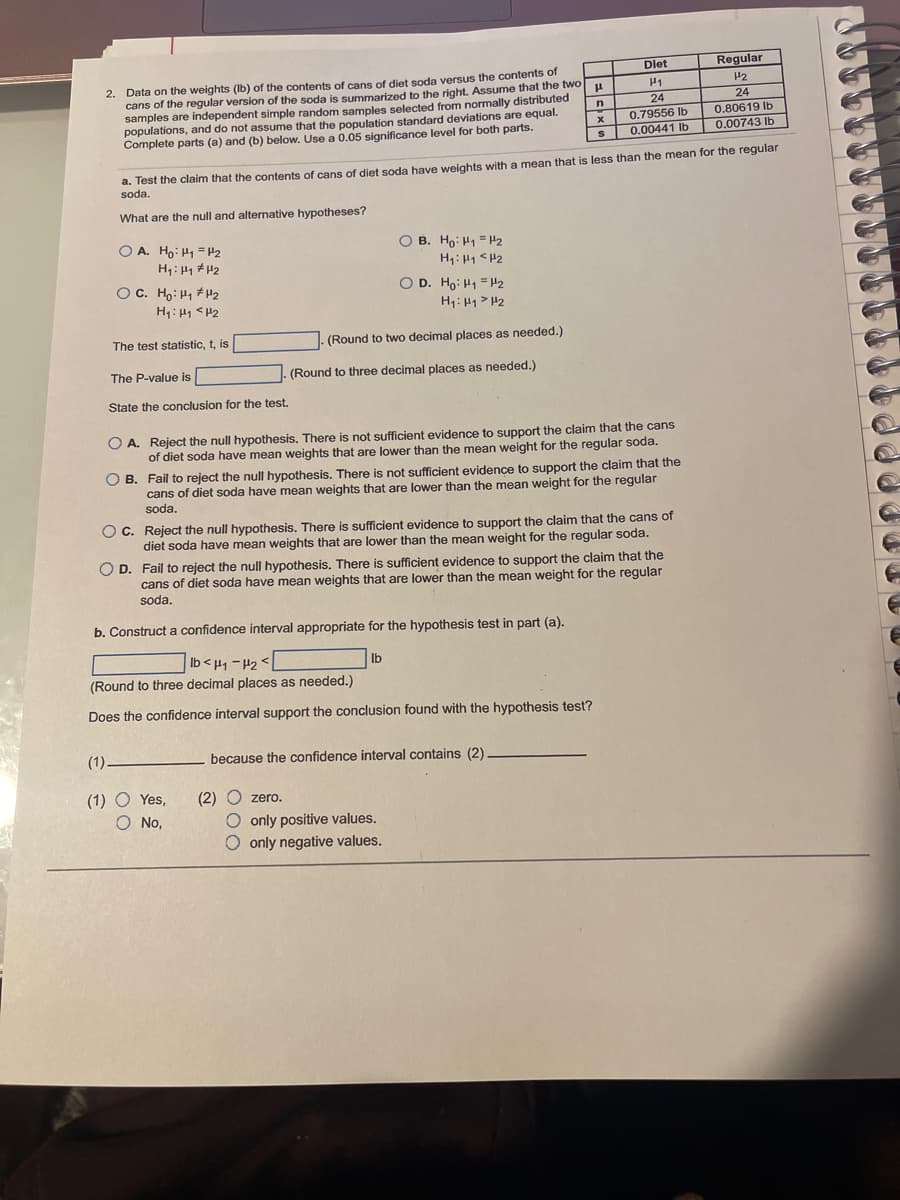
Transcribed Image Text:Dlet
Regular
2. Data on the weights (Ib) of the contents of cans of diet soda versus the contents of
cans of the regular version of the soda is summarized to the right. Assume that the two
samples are independent simple random samples selected from normally distributed
populations, and do not assume that the population standard deviations are equal.
Complete parts (a) and (b) below. Use a 0.05 significance level for both parts.
H1
H2
24
0,80619 Ib
24
n
0.79556 Ib
0.00441 Ib
0.00743 Ib
a. Test the claim that the contents of cans of diet soda have weights with a mean that is less than the mean for the regular
soda.
What are the null and alternative hypotheses?
O B. Ho: H1 = H2
H1: H1 <H2
O D. Ho: H1 = H2
O A. Ho: H1 =P2
OC. Ho: H1 +H2
H1: 41 <H2
H1: 41> H2
The test statistic, t, is
(Round to two decimal places as needed.)
The P-value is
(Round to three decimal places as needed.)
State the conclusion for the test.
O A. Reject the null hypothesis. There is not sufficient evidence to support the claim that the cans
of diet soda have mean weights that are lower than the mean weight for the regular soda.
O B. Fail to reject the null hypothesis. There is not sufficient evidence to support the claim that the
cans of diet soda have mean weights that are lower than the mean weight for the regular
soda.
O C. Reject the null hypothesis. There is sufficient evidence to support the claim that the cans of
diet soda have mean weights that are lower than the mean weight for the regular soda.
O D. Fail to reject the null hypothesis. There is sufficient evidence to support the claim that the
cans of diet soda have mean weights that are lower than the mean weight for the regular
soda.
b. Construct a confidence interval appropriate for the hypothesis test in part (a).
Ib < 41 -H2 <
Ib
(Round to three decimal places as needed.)
Does the confidence interval support the conclusion found with the hypothesis test?
(1)-
because the confidence interval contains (2)
(1) O Yes,
O No,
(2)
O only positive values.
O only negative values.
O zero.
Expert Solution
This question has been solved!
Explore an expertly crafted, step-by-step solution for a thorough understanding of key concepts.

This is a popular solution!

Trending now
This is a popular solution!

Step by step
Solved in 2 steps with 1 images

Recommended textbooks for you
MATLAB: An Introduction with Applications
Statistics
ISBN:
9781119256830
Author:
Amos Gilat
Publisher:
John Wiley & Sons Inc

Probability and Statistics for Engineering and th…
Statistics
ISBN:
9781305251809
Author:
Jay L. Devore
Publisher:
Cengage Learning

Statistics for The Behavioral Sciences (MindTap C…
Statistics
ISBN:
9781305504912
Author:
Frederick J Gravetter, Larry B. Wallnau
Publisher:
Cengage Learning
MATLAB: An Introduction with Applications
Statistics
ISBN:
9781119256830
Author:
Amos Gilat
Publisher:
John Wiley & Sons Inc
Probability and Statistics for Engineering and th…
Statistics
ISBN:
9781305251809
Author:
Jay L. Devore
Publisher:
Cengage Learning
Statistics for The Behavioral Sciences (MindTap C…
Statistics
ISBN:
9781305504912
Author:
Frederick J Gravetter, Larry B. Wallnau
Publisher:
Cengage Learning

Elementary Statistics: Picturing the World (7th E…
Statistics
ISBN:
9780134683416
Author:
Ron Larson, Betsy Farber
Publisher:
PEARSON

The Basic Practice of Statistics
Statistics
ISBN:
9781319042578
Author:
David S. Moore, William I. Notz, Michael A. Fligner
Publisher:
W. H. Freeman

Introduction to the Practice of Statistics
Statistics
ISBN:
9781319013387
Author:
David S. Moore, George P. McCabe, Bruce A. Craig
Publisher:
W. H. Freeman