Do shoppers at the mall spend the same amount of money on average the day after Thanksgiving compared to the day after Christmas? The 40 randomly surveyed shoppers on the day after Thanksgiving spent an average of $146. Their standard deviation was $37. The 48 randomly surveyed shoppers on the day after Christmas spent an average of $166. Their standard deviation was $25. What can be concluded at the a = 0.01 level of significance? For this study, we should use Select an answer a. The null and alternative hypotheses would be: Ho: Select an answer V Select an answer v Select an answer v H: Select an answer v Select an answer v| Select an answer v b. The test statistic ? v = (please show your answer to 3 decimal places.) c. The p-value = (Please show your answer to 4 decimal places.) d. The p-value is ?v a e. Based on this, we should Select an answer v the null hypothesis. f. Thus, the final conclusion is that ...
Do shoppers at the mall spend the same amount of money on average the day after Thanksgiving compared to the day after Christmas? The 40 randomly surveyed shoppers on the day after Thanksgiving spent an average of $146. Their standard deviation was $37. The 48 randomly surveyed shoppers on the day after Christmas spent an average of $166. Their standard deviation was $25. What can be concluded at the a = 0.01 level of significance? For this study, we should use Select an answer a. The null and alternative hypotheses would be: Ho: Select an answer V Select an answer v Select an answer v H: Select an answer v Select an answer v| Select an answer v b. The test statistic ? v = (please show your answer to 3 decimal places.) c. The p-value = (Please show your answer to 4 decimal places.) d. The p-value is ?v a e. Based on this, we should Select an answer v the null hypothesis. f. Thus, the final conclusion is that ...

MATLAB: An Introduction with Applications
6th Edition
ISBN:9781119256830
Author:Amos Gilat
Publisher:Amos Gilat
Chapter1: Starting With Matlab
Section: Chapter Questions
Problem 1P

Related questions
Question
100%
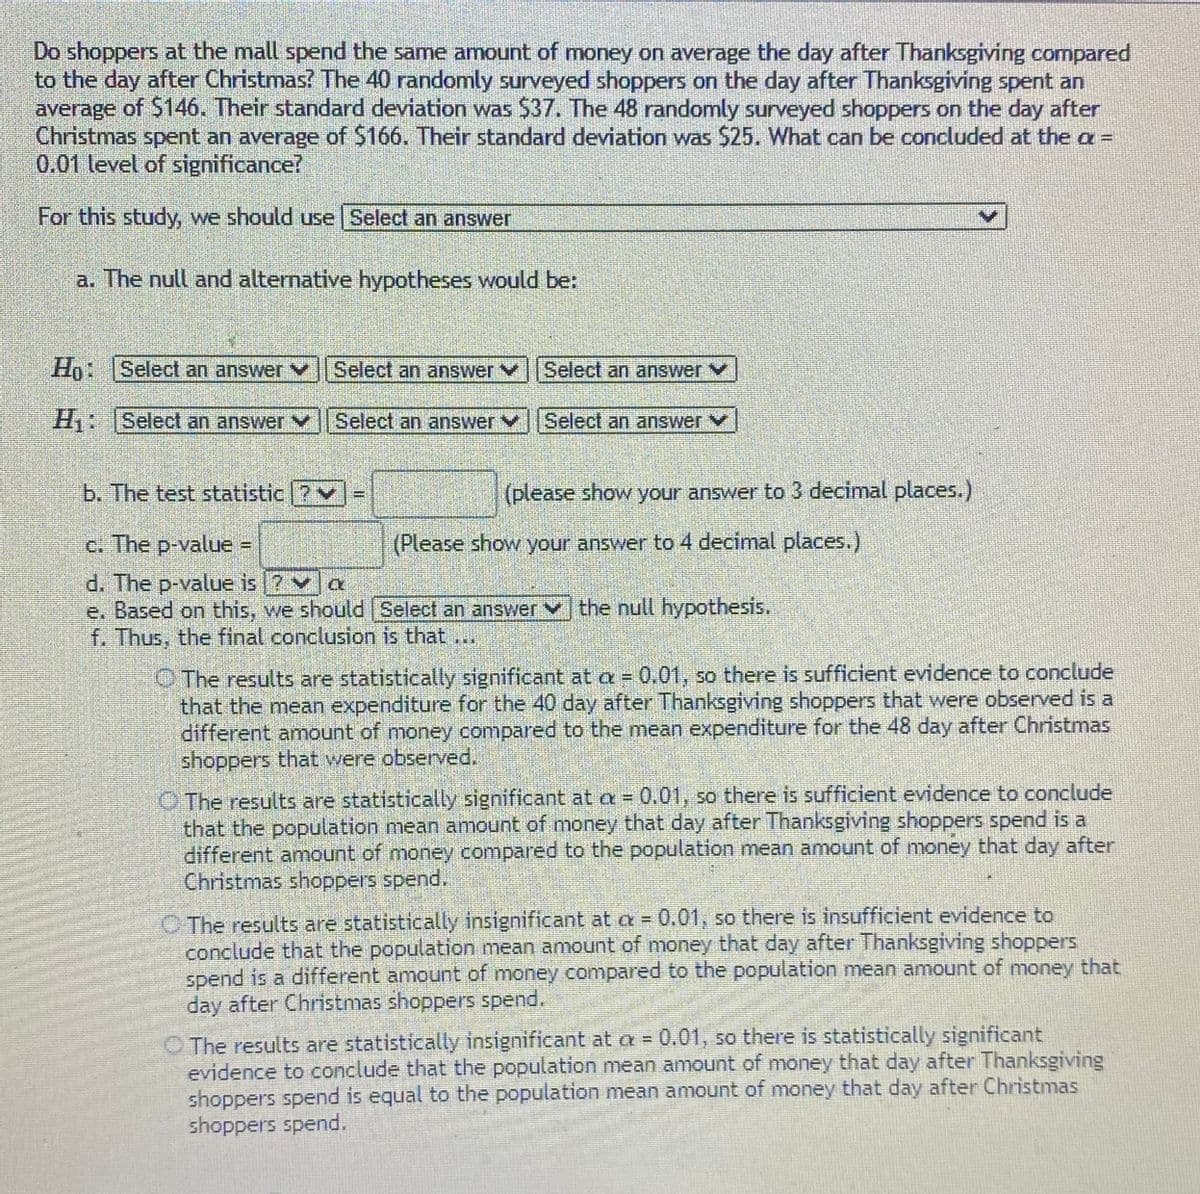
Transcribed Image Text:Do shoppers at the mall spend the same amount of money on average the day after Thanksgiving compared
to the day after Christmas? The 40 randomly surveyed shoppers on the day after Thanksgiving spent an
average of S146. Their standard deviation was $37. The 48 randomly surveyed shoppers on the day after
Christmas spent an average of $166. Their standard deviation was $25. What can be concluded at the a =
0.01 level of significance?
For this study, we should use Select an answer
a. The null and alternative hypotheses would be:
Ho: Select an answer V
Select an answer
Select an answer v
H:
Select an answer vSelect an answerV
Select an answer V
b. The test statistic ?v
(please show your answer to 3 decimal places.)
c. The p-value =
(Please show your answer to 4 decimal places.)
d. The p-value is 7va
e. Based on this, we should Select an answer v the null hypothesis.
f. Thus, the final conclusion is that
O The results are statistically significant at a= 0.01, so there is sufficient evidence to conclude
that the mean expenditure for the 40 day after Thanksgiving shoppers that were observed is a
different amount of money compared to the mean expenditure for the 48 day after Christmas
shoppers that were observed.
O The results are statistically significant at a = 0.01, so there is sufficient evidence to conclude
that the population mean amount of money that day after Thanksgiving shoppers spend is a
different amount of money compared to the population mean amount of money that day after
Christmas shoppers spend.
O The results are statistically insignificant at a = 0.01, so there is insufficient evidence to
conclude that the population mean amount of money that day after Thanksgiving shoppers
spend is a different amount of money compared to the population mean amount of money that
day after Christmas shoppers spend.
O The results are statistically insignificant at a = 0.01, so there is statistically significant
evidence to conclude that the population mean amount of money that day after Thanksgiving
shoppers spend is equal to the population mean amount of money that day after Christmas
shoppers spend.
Expert Solution
This question has been solved!
Explore an expertly crafted, step-by-step solution for a thorough understanding of key concepts.

This is a popular solution!

Trending now
This is a popular solution!

Step by step
Solved in 6 steps

Recommended textbooks for you
MATLAB: An Introduction with Applications
Statistics
ISBN:
9781119256830
Author:
Amos Gilat
Publisher:
John Wiley & Sons Inc

Probability and Statistics for Engineering and th…
Statistics
ISBN:
9781305251809
Author:
Jay L. Devore
Publisher:
Cengage Learning

Statistics for The Behavioral Sciences (MindTap C…
Statistics
ISBN:
9781305504912
Author:
Frederick J Gravetter, Larry B. Wallnau
Publisher:
Cengage Learning
MATLAB: An Introduction with Applications
Statistics
ISBN:
9781119256830
Author:
Amos Gilat
Publisher:
John Wiley & Sons Inc
Probability and Statistics for Engineering and th…
Statistics
ISBN:
9781305251809
Author:
Jay L. Devore
Publisher:
Cengage Learning
Statistics for The Behavioral Sciences (MindTap C…
Statistics
ISBN:
9781305504912
Author:
Frederick J Gravetter, Larry B. Wallnau
Publisher:
Cengage Learning

Elementary Statistics: Picturing the World (7th E…
Statistics
ISBN:
9780134683416
Author:
Ron Larson, Betsy Farber
Publisher:
PEARSON

The Basic Practice of Statistics
Statistics
ISBN:
9781319042578
Author:
David S. Moore, William I. Notz, Michael A. Fligner
Publisher:
W. H. Freeman

Introduction to the Practice of Statistics
Statistics
ISBN:
9781319013387
Author:
David S. Moore, George P. McCabe, Bruce A. Craig
Publisher:
W. H. Freeman