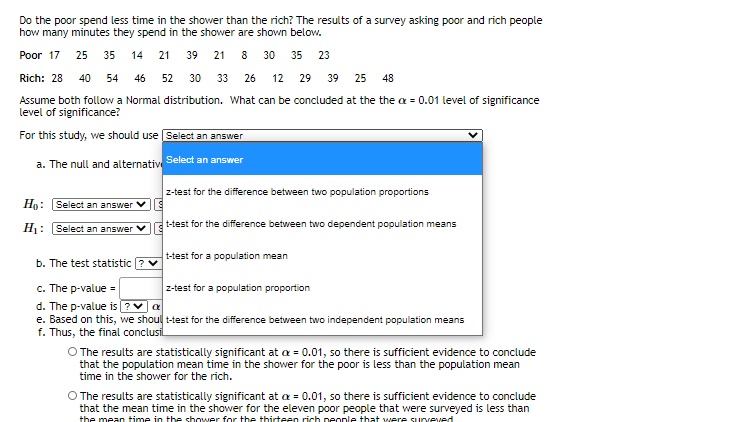
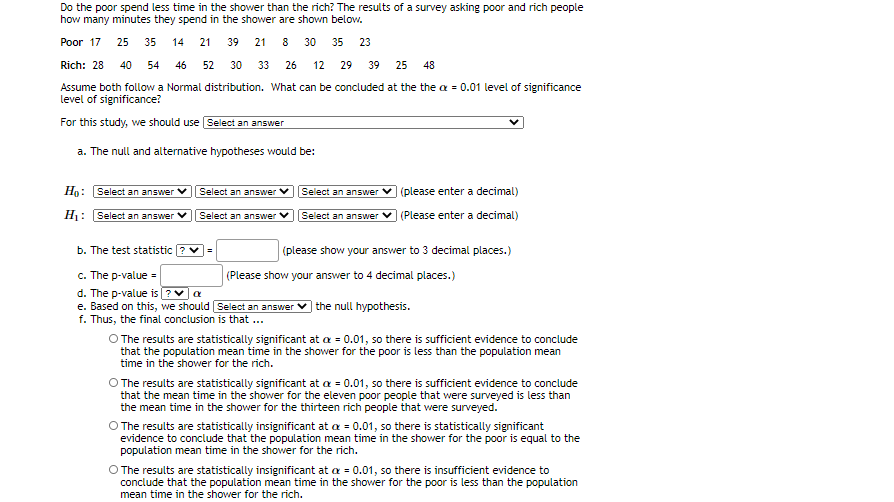
Do the poor spend less time in the shower than the rich? The results of a survey asking poor and rich people how many minutes they spend in the shower are shown below. Poor 17 25 35 14 21 39 21 8 30 35 23 Rich: 28 40 54 46 52 30 33 26 12 29 39 25 48 Assume both follow a Normal distribution. What can be concluded at the the a = 0.01 level of significance level of significance? For this study, we should use Select an answer a. The null and alternative hypotheses would be: Họ: Select an answer* H1: Select an answer ) (please enter a decimal) | (Please enter a decimal) Select an answer Select an answer Select an answer' Select an answer b. The test statisti ( (please show your answer to 3 decimal places.) (Please show your answer to 4 decimal places.) c. The p-value = d. The p-value is( e. Based on this, we should Select an answer ) the null hypothesis. f. Thus, the final conclusion is that ... O The results are statistically significant at a = 0.01, so there is sufficient evidence to conclude that the population mean time in the shower for the poor is less than the population mean time in the shower for the rich. O The results are statistically significant at a = 0.01, so there is sufficient evidence to conclude that the mean time in the shower for the eleven poor people that were surveyed is less than the mean time in the shower for the thirteen rich people that were surveyed. O The results are statistically insignificant at a = 0.01, so there is statistically significant evidence to conclude that the population mean time in the shower for the poor is equal to the population mean time in the shower for the rich. O The results are statistically insignificant at a = 0.01, so there is insufficient evidence to conclude that the population mean time in the shower for the poar is less than the population mean time in the shower for the rich.


Inverse Normal Distribution
The method used for finding the corresponding z-critical value in a normal distribution using the known probability is said to be an inverse normal distribution. The inverse normal distribution is a continuous probability distribution with a family of two parameters.
Mean, Median, Mode
It is a descriptive summary of a data set. It can be defined by using some of the measures. The central tendencies do not provide information regarding individual data from the dataset. However, they give a summary of the data set. The central tendency or measure of central tendency is a central or typical value for a probability distribution.
Z-Scores
A z-score is a unit of measurement used in statistics to describe the position of a raw score in terms of its distance from the mean, measured with reference to standard deviation from the mean. Z-scores are useful in statistics because they allow comparison between two scores that belong to different normal distributions.
please do
" for this study, we should use.... (second screenshot) and b & c


Trending now
This is a popular solution!

Step by step
Solved in 2 steps


