Do you carpool? Let X represent the number of occupants in a randomly chosen car on a certain stretch of highway during morning commute hours. A survey of cars showed that the probability distribution of X is as follows. 1 4 P (x) 0.67 0.13 0.09 0.01 0.10
Do you carpool? Let X represent the number of occupants in a randomly chosen car on a certain stretch of highway during morning commute hours. A survey of cars showed that the probability distribution of X is as follows. 1 4 P (x) 0.67 0.13 0.09 0.01 0.10

MATLAB: An Introduction with Applications
6th Edition
ISBN:9781119256830
Author:Amos Gilat
Publisher:Amos Gilat
Chapter1: Starting With Matlab
Section: Chapter Questions
Problem 1P

Related questions
Question
Let X represent the number of occupants in a randomly chosen car on a certain stretch of highway during
morning commute hours. A survey of cars showed that the probability distribution of X is as follows. Answer the questions below.
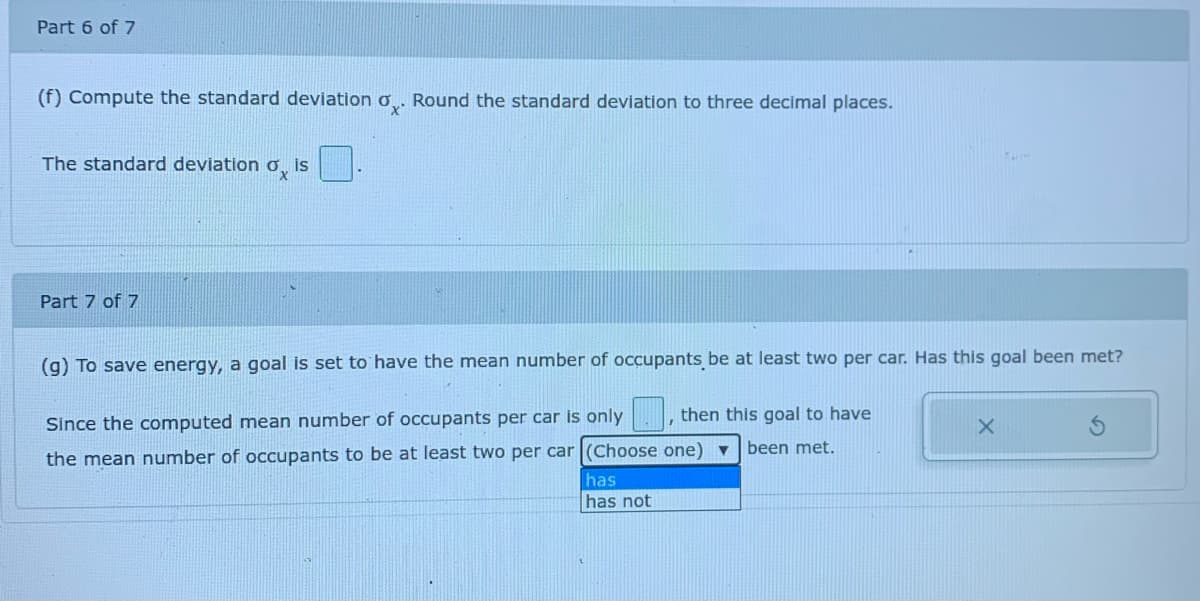
Transcribed Image Text:Part 6 of 7
(f) Compute the standard deviation Ơ. Round the standard deviation to three decimal places.
The standard deviation o
is
Part 7 of 7
(g) To save energy, a goal is set to have the mean number of occupants be at least two per car. Has this goal been met?
then this goal to have
Since the computed mean number of occupants per car is only
been met.
the mean number of occupants to be at least two per car (Choose one) ▼
has
has not
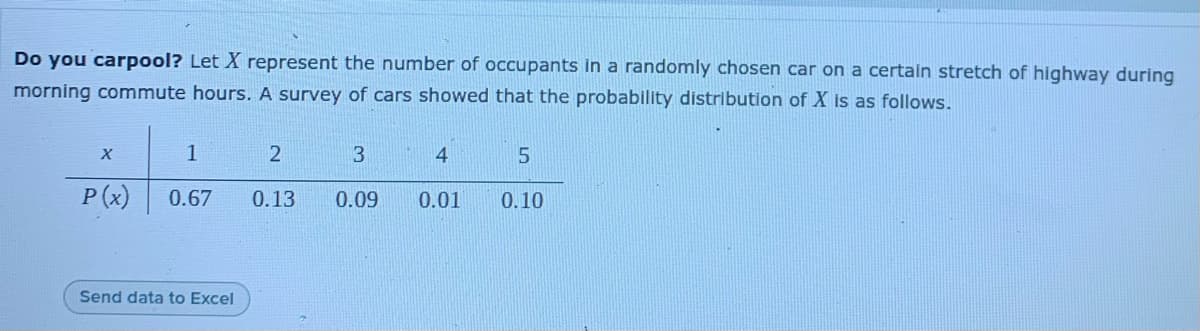
Transcribed Image Text:Do you carpool? Let X represent the number of occupants in a randomly chosen car on a certain stretch of highway during
morning commute hours. A survey of cars showed that the probability distribution of X is as follows.
X
1
P (x)
0.67
0.13
0.09
0.01
0.10
Send data to Excel
Expert Solution
This question has been solved!
Explore an expertly crafted, step-by-step solution for a thorough understanding of key concepts.

This is a popular solution!

Trending now
This is a popular solution!

Step by step
Solved in 2 steps with 1 images

Recommended textbooks for you
MATLAB: An Introduction with Applications
Statistics
ISBN:
9781119256830
Author:
Amos Gilat
Publisher:
John Wiley & Sons Inc

Probability and Statistics for Engineering and th…
Statistics
ISBN:
9781305251809
Author:
Jay L. Devore
Publisher:
Cengage Learning

Statistics for The Behavioral Sciences (MindTap C…
Statistics
ISBN:
9781305504912
Author:
Frederick J Gravetter, Larry B. Wallnau
Publisher:
Cengage Learning
MATLAB: An Introduction with Applications
Statistics
ISBN:
9781119256830
Author:
Amos Gilat
Publisher:
John Wiley & Sons Inc
Probability and Statistics for Engineering and th…
Statistics
ISBN:
9781305251809
Author:
Jay L. Devore
Publisher:
Cengage Learning
Statistics for The Behavioral Sciences (MindTap C…
Statistics
ISBN:
9781305504912
Author:
Frederick J Gravetter, Larry B. Wallnau
Publisher:
Cengage Learning

Elementary Statistics: Picturing the World (7th E…
Statistics
ISBN:
9780134683416
Author:
Ron Larson, Betsy Farber
Publisher:
PEARSON

The Basic Practice of Statistics
Statistics
ISBN:
9781319042578
Author:
David S. Moore, William I. Notz, Michael A. Fligner
Publisher:
W. H. Freeman

Introduction to the Practice of Statistics
Statistics
ISBN:
9781319013387
Author:
David S. Moore, George P. McCabe, Bruce A. Craig
Publisher:
W. H. Freeman