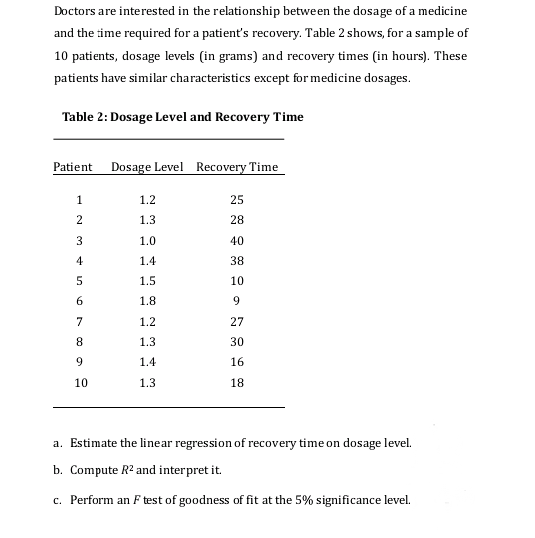
Doctors are interested in the relationship between the dosage of a medicine and the ime required for a patient's recovery. Table 2 shows, for a sample of 10 patients, dosage levels (in grams) and recovery times (in hours). These patients have similar characteristics except for medicine dosages. Table 2: Dosage Level and Recovery Time Patient Dosage Level Recovery Time 1.2 25 2 1.3 28 1.0 40 4 1.4 38 5 1.5 10 6. 1.8 9 7 1.2 27 8 1.3 30 9. 1.4 16 10 1.3 18 a. Estimate the linear regression of recovery time on dosage level. b. Compute R2 and interpret it. c. Perform an F test of goodness of fit at the 5% significance level.
Doctors are interested in the relationship between the dosage of a medicine and the ime required for a patient's recovery. Table 2 shows, for a sample of 10 patients, dosage levels (in grams) and recovery times (in hours). These patients have similar characteristics except for medicine dosages. Table 2: Dosage Level and Recovery Time Patient Dosage Level Recovery Time 1.2 25 2 1.3 28 1.0 40 4 1.4 38 5 1.5 10 6. 1.8 9 7 1.2 27 8 1.3 30 9. 1.4 16 10 1.3 18 a. Estimate the linear regression of recovery time on dosage level. b. Compute R2 and interpret it. c. Perform an F test of goodness of fit at the 5% significance level.

Glencoe Algebra 1, Student Edition, 9780079039897, 0079039898, 2018
18th Edition
ISBN:9780079039897
Author:Carter
Publisher:Carter
Chapter10: Statistics
Section10.6: Summarizing Categorical Data
Problem 24PPS

Related questions
Question
Transcribed Image Text:Doctors are interested in the relationship between the dosage of a medicine
and the time required for a patient's recovery. Table 2 shows, for a sample of
10 patients, dosage levels (in grams) and recovery times (in hours). These
patients have similar characteristics except for medicine dosages.
Table 2: Dosage Level and Recovery Time
Patient
Dosage Level Recovery Time
1
1.2
25
2
1.3
28
3
1.0
40
4
1.4
38
1.5
10
6.
1.8
9.
7
1.2
27
8.
1.3
30
9.
1.4
16
10
1.3
18
a. Estimate the linear regression of recovery time on dosage level.
b. Compute R2 and interpret it.
c. Perform an F test of goodness of fit at the 5% significance level.
Expert Solution
This question has been solved!
Explore an expertly crafted, step-by-step solution for a thorough understanding of key concepts.

Step by step
Solved in 2 steps with 1 images

Recommended textbooks for you
Glencoe Algebra 1, Student Edition, 9780079039897…
Algebra
ISBN:
9780079039897
Author:
Carter
Publisher:
McGraw Hill

Algebra: Structure And Method, Book 1
Algebra
ISBN:
9780395977224
Author:
Richard G. Brown, Mary P. Dolciani, Robert H. Sorgenfrey, William L. Cole
Publisher:
McDougal Littell

College Algebra (MindTap Course List)
Algebra
ISBN:
9781305652231
Author:
R. David Gustafson, Jeff Hughes
Publisher:
Cengage Learning
Glencoe Algebra 1, Student Edition, 9780079039897…
Algebra
ISBN:
9780079039897
Author:
Carter
Publisher:
McGraw Hill
Algebra: Structure And Method, Book 1
Algebra
ISBN:
9780395977224
Author:
Richard G. Brown, Mary P. Dolciani, Robert H. Sorgenfrey, William L. Cole
Publisher:
McDougal Littell
College Algebra (MindTap Course List)
Algebra
ISBN:
9781305652231
Author:
R. David Gustafson, Jeff Hughes
Publisher:
Cengage Learning