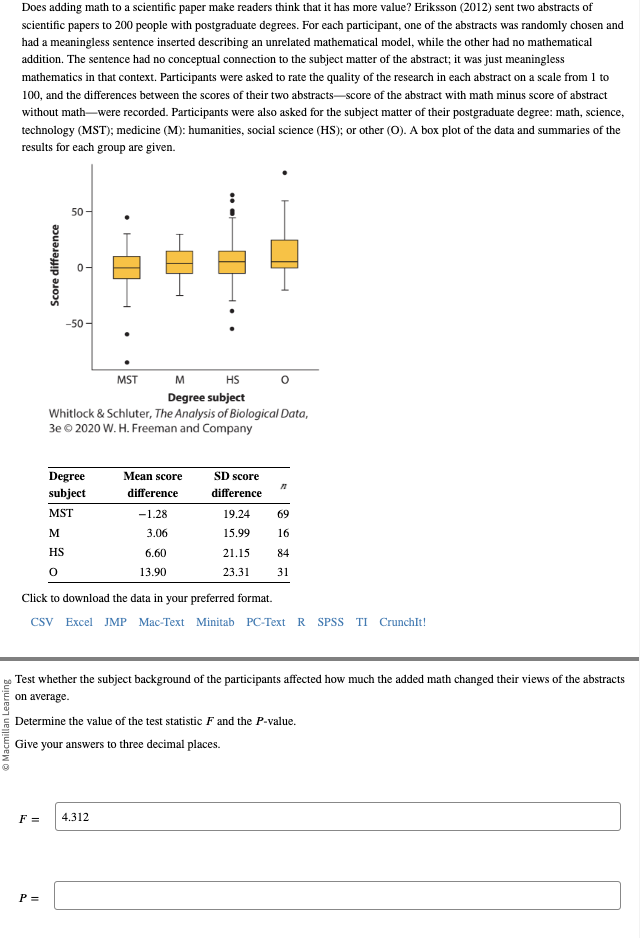
Does adding math to a scientific paper make readers think that it has more value? Eriksson (2012) sent two abstracts of scientific papers to 200 people with postgraduate degrees. For each participant, one of the abstracts was randomly chosen and had a meaningless sentence inserted describing an unrelated mathematical model, while the other had no mathematical addition. The sentence had no conceptual connection to the subject matter of the abstract; it was just meaningless mathematics in that context. Participants were asked to rate the quality of the research in each abstract on a scale from 1 to 100, and the differences between the scores of their two abstracts-score of the abstract with math minus score of abstract without math were recorded. Participants were also asked for the subject matter of their postgraduate degree: math, science, technology (MST); medicine (M): humanities, social science (HS); or other (O). A box plot of the data and summaries of the results for each group are given. Score difference 50- -50 M HS Degree subject Whitlock & Schluter, The Analysis of Biological Data, 3e © 2020 W. H. Freeman and Company M HS 0 P= Degree subject MST MST Mean score difference -1.28 3.06 6.60 13.90 F = 4.312 SD score difference n 19.24 69 15.99 16 Click to download the data in your preferred format. CSV Excel JMP Mac-Text Minitab PC-Text R SPSS TI CrunchIt! 21.15 84 23.31 31 Test whether the subject background of the participants affected how much the added math changed their views of the abstracts on average. Determine the value of the test statistic F and the P-value. Give your answers to three decimal places.
Does adding math to a scientific paper make readers think that it has more value? Eriksson (2012) sent two abstracts of scientific papers to 200 people with postgraduate degrees. For each participant, one of the abstracts was randomly chosen and had a meaningless sentence inserted describing an unrelated mathematical model, while the other had no mathematical addition. The sentence had no conceptual connection to the subject matter of the abstract; it was just meaningless mathematics in that context. Participants were asked to rate the quality of the research in each abstract on a scale from 1 to 100, and the differences between the scores of their two abstracts-score of the abstract with math minus score of abstract without math were recorded. Participants were also asked for the subject matter of their postgraduate degree: math, science, technology (MST); medicine (M): humanities, social science (HS); or other (O). A box plot of the data and summaries of the results for each group are given. Score difference 50- -50 M HS Degree subject Whitlock & Schluter, The Analysis of Biological Data, 3e © 2020 W. H. Freeman and Company M HS 0 P= Degree subject MST MST Mean score difference -1.28 3.06 6.60 13.90 F = 4.312 SD score difference n 19.24 69 15.99 16 Click to download the data in your preferred format. CSV Excel JMP Mac-Text Minitab PC-Text R SPSS TI CrunchIt! 21.15 84 23.31 31 Test whether the subject background of the participants affected how much the added math changed their views of the abstracts on average. Determine the value of the test statistic F and the P-value. Give your answers to three decimal places.

MATLAB: An Introduction with Applications
6th Edition
ISBN:9781119256830
Author:Amos Gilat
Publisher:Amos Gilat
Chapter1: Starting With Matlab
Section: Chapter Questions
Problem 1P

Related questions
Question
please answer this question!
Transcribed Image Text:Macmillan Learning
Does adding math to a scientific paper make readers think that it has more value? Eriksson (2012) sent two abstracts of
scientific papers to 200 people with postgraduate degrees. For each participant, one of the abstracts was randomly chosen and
had a meaningless sentence inserted describing an unrelated mathematical model, while the other had no mathematical
addition. The sentence had no conceptual connection to the subject matter of the abstract; it was just meaningless
mathematics in that context. Participants were asked to rate the quality of the research in each abstract on a scale from 1 to
100, and the differences between the scores of their two abstracts-score of the abstract with math minus score of abstract
without math-were recorded. Participants were also asked for the subject matter of their postgraduate degree: math, science,
technology (MST); medicine (M): humanities, social science (HS); or other (O). A box plot of the data and summaries of the
results for each group are given.
Score difference
F =
50-
P =
6
M
HS
0
-50-
M
HS
Degree subject
Whitlock & Schluter, The Analysis of Biological Data,
3e © 2020 W. H. Freeman and Company
Degree
subject
MST
MST
Mean score
difference
-1.28
3.06
6.60
13.90
SD score
difference
Click to download the data in your preferred format.
CSV Excel JMP Mac-Text Minitab PC-Text R SPSS TI CrunchIt!
4.312
11
Test whether the subject background of the participants affected how much the added math changed their views of the abstracts
on average.
19.24
69
15.99 16
21.15
84
23.31 31
Determine the value of the test statistic F and the P-value.
Give your answers to three decimal places.
Expert Solution
This question has been solved!
Explore an expertly crafted, step-by-step solution for a thorough understanding of key concepts.

This is a popular solution!

Trending now
This is a popular solution!

Step by step
Solved in 3 steps with 4 images

Recommended textbooks for you
MATLAB: An Introduction with Applications
Statistics
ISBN:
9781119256830
Author:
Amos Gilat
Publisher:
John Wiley & Sons Inc

Probability and Statistics for Engineering and th…
Statistics
ISBN:
9781305251809
Author:
Jay L. Devore
Publisher:
Cengage Learning

Statistics for The Behavioral Sciences (MindTap C…
Statistics
ISBN:
9781305504912
Author:
Frederick J Gravetter, Larry B. Wallnau
Publisher:
Cengage Learning
MATLAB: An Introduction with Applications
Statistics
ISBN:
9781119256830
Author:
Amos Gilat
Publisher:
John Wiley & Sons Inc
Probability and Statistics for Engineering and th…
Statistics
ISBN:
9781305251809
Author:
Jay L. Devore
Publisher:
Cengage Learning
Statistics for The Behavioral Sciences (MindTap C…
Statistics
ISBN:
9781305504912
Author:
Frederick J Gravetter, Larry B. Wallnau
Publisher:
Cengage Learning

Elementary Statistics: Picturing the World (7th E…
Statistics
ISBN:
9780134683416
Author:
Ron Larson, Betsy Farber
Publisher:
PEARSON

The Basic Practice of Statistics
Statistics
ISBN:
9781319042578
Author:
David S. Moore, William I. Notz, Michael A. Fligner
Publisher:
W. H. Freeman

Introduction to the Practice of Statistics
Statistics
ISBN:
9781319013387
Author:
David S. Moore, George P. McCabe, Bruce A. Craig
Publisher:
W. H. Freeman